
Week 24(12/06-18/06): 3 Things You Should Be Aware of in the Freezing Winter

Key Takeaways:
With the volume of $5.583B involved, Week 24 is one hell of a week in terms of MEV on Ethereum.
Sandwich has always been the biggest threat to retail investors swapping crypto assets.
However, Sandwich was not the most profitable arbitrage type in the week.

For most parts of the world, Week 24th is usually the hottest time of the year. But for the Crypto participants, saying their hearts are icy cold is an understatement.
“Winter is coming” has become a cliche under the current weather of the market.
Everyone would agree that we are under the bear craw. After all the dramas, starting with $LUNA and $UST, freezings, implemented by Celsius and Babel, liquidations, shown in our data, and betrayals from Celsius and 3AC, everyone was looking for a safe for all the assets they had left.
However, the exodus was not as safe and sound as people expected. About $1.6 billion was done by arbitrages like spatial, triangular, and combination, which are not as detrimental as front-running sandwiches. The latter’s total volume last week reached $3.88 billion, increasing 84% from the week before and doubling the total of other arbitrages. The most evident case can be found in this article: Over $35M USDT-DAI Swapping Suffered $268K Loss by 3 Sandwiches in 7 Minutes.
To get a better sense of what was going on last week, it’s essential we zoom out from the perspective of 30 days.
This report’s data focuses on Ethereum, the biggest TVL holder in the web3 world.
We’d like to present you the data mostly in the following dimensions:
Volume: this is the indicator showing the severity of arbitrages regarding asset value in the market.
Profit: illustrates the earning capacity of the searchers.
Cost: tells you how much searchers spent on gas fees and miner tips for arbitrages, especially for front-running ones.
Tx count: is the frequency of arbitrages.
ROI: is calculated using profit to divide the cost.
Trends of 30 Days
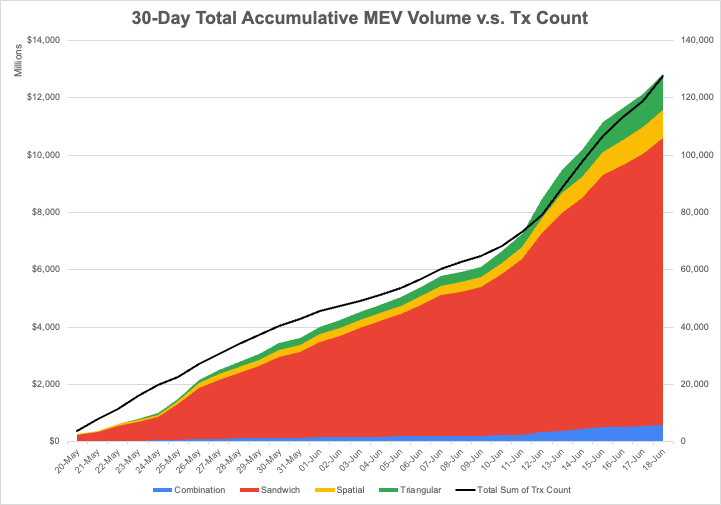
30-Day Total Accumulative MEV Volume v.s. Tx Count
Examing the accumulative volume chart, we can’t help but notice 3 things.
The lines have become steeper since June 11. That’s when the stETH started to lose peg and a chain of reaction followed. The ensued volatility provided more opportunities than before. Half of the total volume was done in the last 7 days out of the 30.
Most of the MEV arbitrages have been consistently happening as front-running, a.k.a.: Sandwich.
The total volume of arbitrages over the last 30 days reached almost $13 billion, about $10 billion, 3/4 of the total, was done using Sandwich.
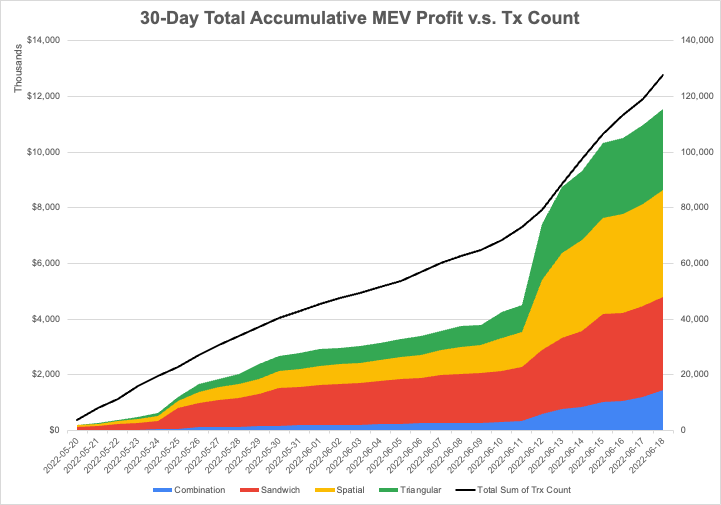
30-Day Total Accumulative MEV Profit v.s. Tx Count
Although Sandwich is the biggest gun regarding volume, it’s not the most profitable one. Since June 11, spatial arbitrage has been the most profitable deal.
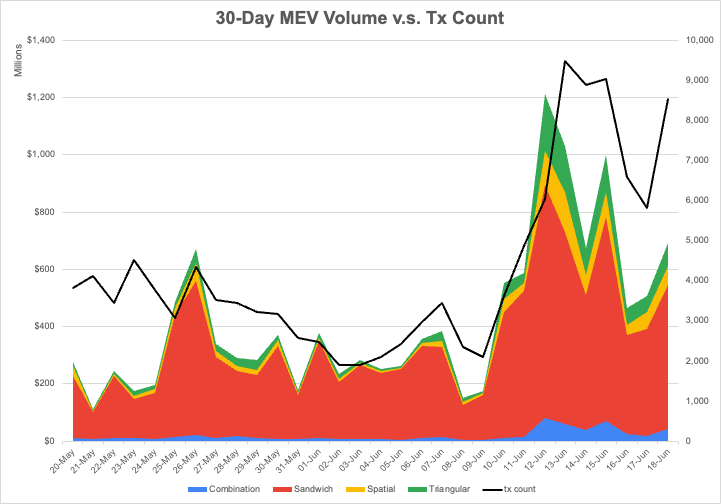
30-Day MEV Volume v.s. Tx Count
Let’s take a glance at the daily volume of the last 30 days. No surprise that the chart is mostly red. And there were 2 days’ volumes over $1B: June 11 and June 12.
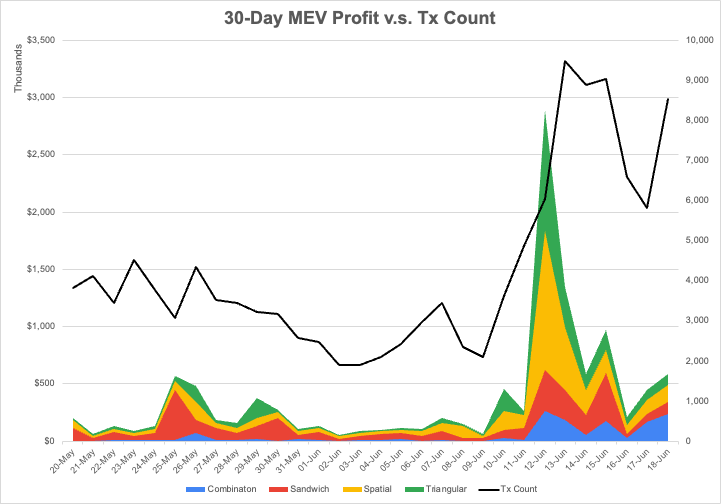
30-Day MEV Profit v.s. Tx Count
These 2 days not only provide the most volumes but the highest batch of profits for Spatial and Triangular arbitrages than Sandwich.
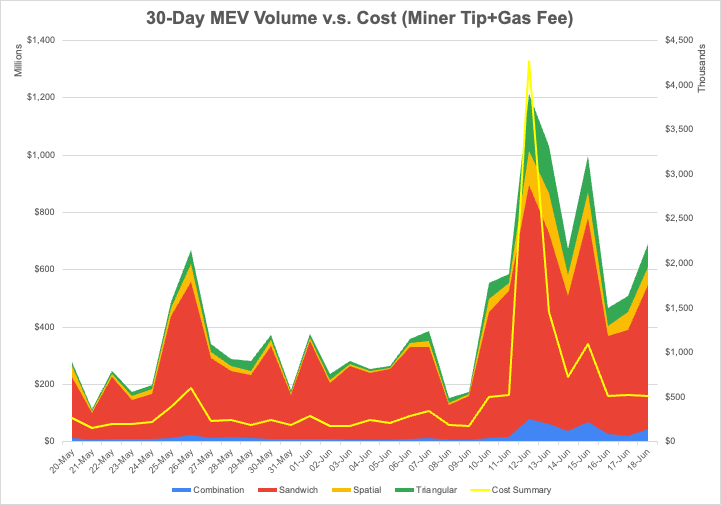
30-Day MEV Volume v.s. Cost(Miner Tips+Gas Fees)
Here is the cost for the last 30 days. The highest ones were spent on June 12. According to @bertcmiller of Flash Bots, searchers paid 1,990 ETH as fees in 4 transactions, including 720 ETH as the biggest Flash Bots bundle payment.
Time to zoom in on Week 24.
Revealing Data of the Week
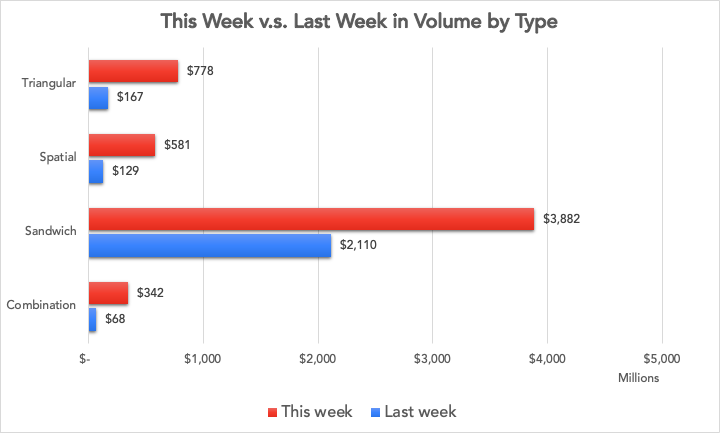
Weekly Volume Comparison by Type
The following bar chart compares Week 25’s 4 arbitrage types’ performances with last week regarding volume. Sandwich reached $3.88B, more than double the amount of the other three’s total volume.
The total volume of Week 24 is $5.583B.
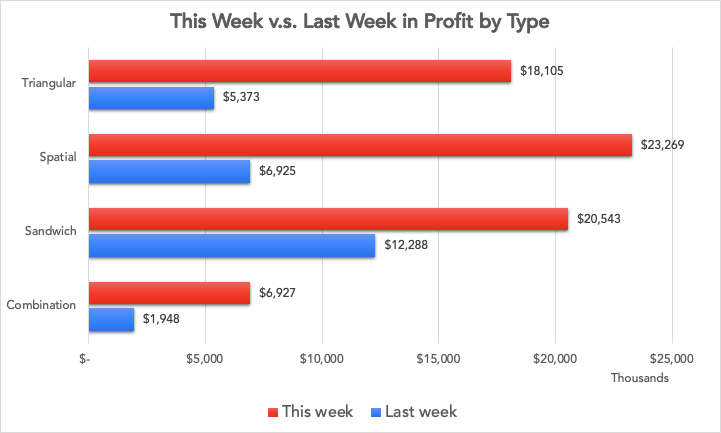
Weekly Profit Comparison by Type
We mentioned spatial arbitrage’s most potent profit-earning power: over $23M, which is 3 times last week’s number.
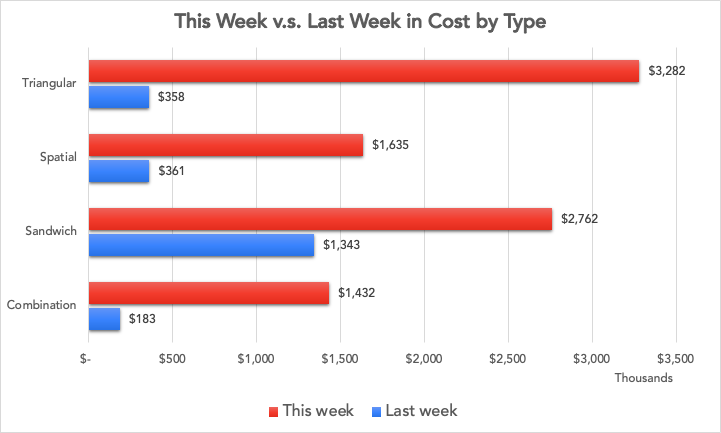
Weekly Cost By Type
Interestingly, the biggest cost surge is from triangular arbitrage. The hasty flow of assets created many fleeting opportunities. For sure searchers did not want to miss them. Hence they had to use the Flash Bots mechanism to bribe the miners.
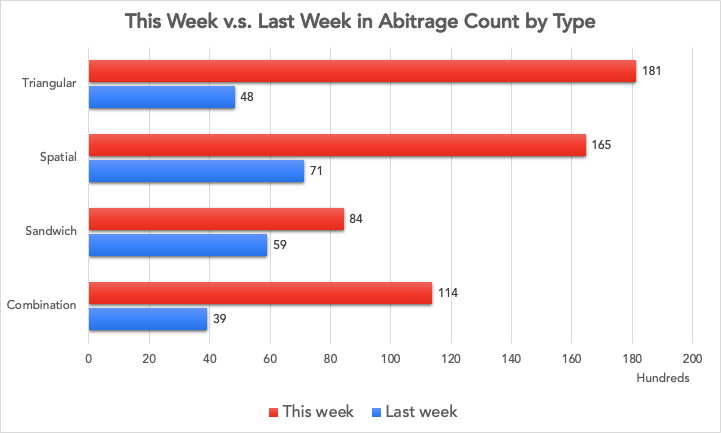
Weekly Arbitrage Count by Type
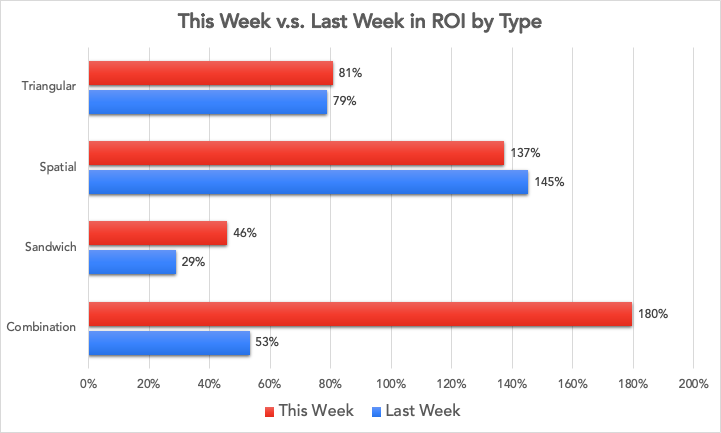
Weekly Average ROI by Type
Perhaps this is the most interesting chart of the week. Even though combination arbitrage had the lowest volume and profit, its weekly average ROI is the highest: about 180%, exceeding last week’s same category 2.5 times and beating the other 3 relatively stable ones.
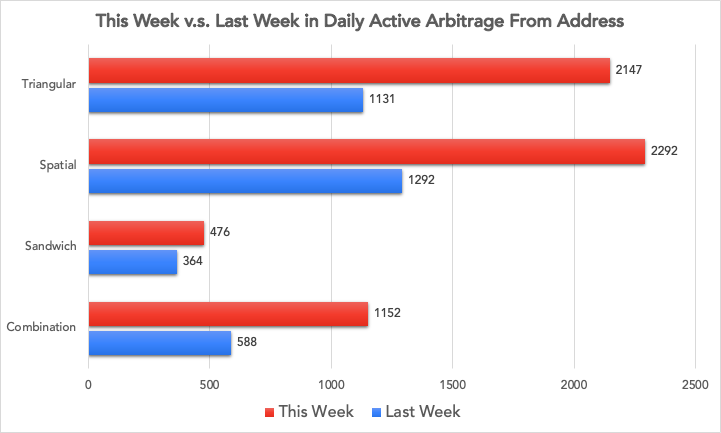
This Week v.s. Last Week in Daily Active Arbitrage From Addresses
The number of daily active arbitrage from addresses reveals the participation levels of searchers. Combination, spatial, and triangular’s numbers all doubled except Sandwich. The higher skill and asset requirements for Sandwich attacks could be the hurdle for more engagement.
A successful front-running demands coding knowledge of transaction rearranging. Employing millions worth of assets to inflate the price of a certain token is not something rarely seen. Moreover, searchers need to pay extra tips to miners for the re-ordering.
Arbitrages, Contracts, and Liquidity Pools
We have compiled a data table including:
Top 10 liquidity pools by volume change% with volume over $10M, showing URL on EigenPhi, token pair, and volume.
Top contracts by profit, showing URL, profit, cost, and ROI
Top contracts by volume, showing URL, volume, profit, cost, and ROI
Combination arbitrage top transaction list by profit, showing URL, token pair, profit, cost, ROI, and volume.
Sandwich arbitrage top transaction list by profit, showing URL, token pair, profit, cost, ROI, and volume.
Spatial arbitrage top transaction list by profit, showing URL, token pair, profit, cost, ROI, and volume.
Triangular arbitrage top transaction list by profit, showing URL, token pair, profit, cost, ROI, and volume.
All the data can be downloaded via this public google sheet. The URL of each item will direct you to the details, including:
token flow chart for arbitrages and transactions. (How to read token flow charts?)
contract’s performance on different arbitrage types.
Top 10 favorite tokens of a contract.
contract’s favorite pools.
liquidity pool’s performance on different arbitrage types.
liquidity pool’s arbitrage profit leaderboard.
With all the data you could play with as the wrap-up, it’s time to finish Week 24’s retrospective on Ethereum’s MEV activities. Meanwhile, don’t forget we’ve started to post DeFi Daily Digest, Arbitrage Daily Report on Ethereum and BNB Chain, and Sandwich Arbitrages Daily Report on Ethereum.
Follow us via these to dig more hidden wisdom of DeFi: