Fueling the Win: Analyzing Builders' Gas Bidding Strategy
Unlocking the Mechanics of Gas-Driven Success in Block Bidding
Our last research on block bidding received great feedback from the community. One of them is suggested by antonydenyer.eth, asking about gas-related comparisons.
Here are the charts.
This chart shows the gas_used field of all the 1,698,090 bids for the 921 blocks. (For the data scopes, Visit the previous post.)
We can see that:
Concentration of High Gas Amounts Around Block Creation Time (T): Most bids with high gas amounts, ranging from 1 million to 3 million units, are concentrated within T-3 to T+3 seconds.
Early and Late Bidding Patterns: Bids placed significantly earlier (before T-3) or later (after T+3) show lower and more scattered gas amounts, implying that bids placed too early or too late tend to include fewer transactions or lower-priority transactions, potentially reducing their competitiveness.
Sparse Low Gas Amount Bids: Throughout the time range, there are scattered bids with lower gas amounts (below 1 million units).
Next, look at how each builder submits their gas_used in their bids.
Here is the combined table summarizing the bidding strategies of Titan, Beaverbuild, Rsync, and other notable builders:
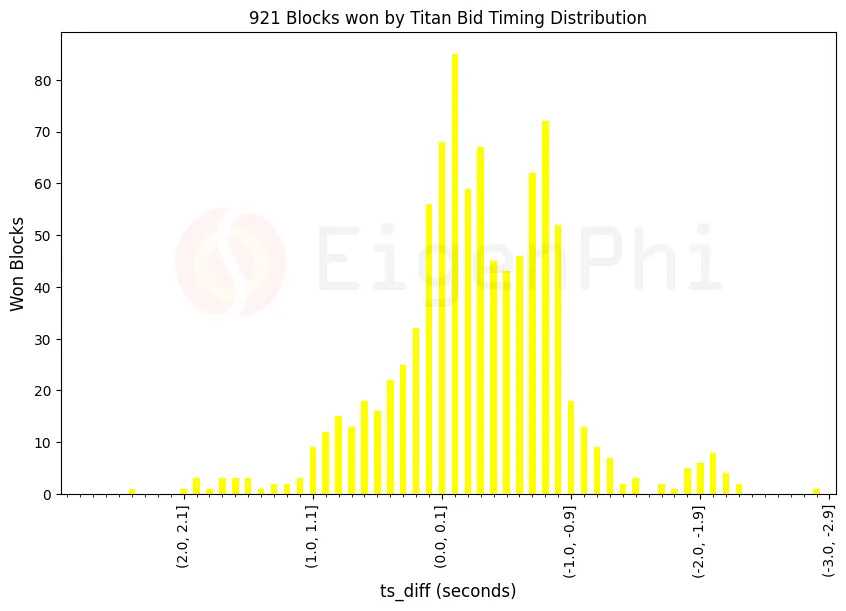
We have shown that Titan won a large part of these 921 blocks after the block production time T.
It’s time to examine the gas_used.
Here are the key findings.
Most of Titan's bids with high gas amounts (1-3 million units) are concentrated within T-3 to T+3 seconds.
The red dots, representing on-chain bids, are mostly concentrated between T-1 and T+1 seconds, with gas amounts ranging from 1 to 2 million units. A big part of this cluster is between T and T+1, illustrating Titan’s “Timing Game” strategy.
Bids placed significantly earlier (before T-3) or later (after T+3) have lower gas amounts and are less dense.
There are scattered bids with lower gas amounts (below 1 million units) throughout the time range, but these are less frequent.
The chart below examines the average and median gas_used of the 921 blocks won by Titan.
It shows that:
In most time intervals, the average and median gas values are close to each other, suggesting a relatively symmetric distribution of gas usage in winning bids. This implies that Titan's gas strategy is balanced.
Significant average and median gas usage peaks are observed at T-2 to T-2.1 seconds and T+1.9 to T+2. These peaks highlight intervals where Titan places especially high gas bids, which are likely to secure critical blocks and maximize MEV extraction.
Data like this reflects the broader dynamics and challenges within the Ethereum bidding ecosystem. Improved data and strategic insights are crucial for evolving Ethereum's design. From the data we can summarize that:
The precise timing of bids around block creation time (T-3 to T+3 seconds) is crucial. Higher gas bids are strategically placed during these moments to maximize the chances of winning blocks.
Titan's bidding strategy focuses on high gas usage during critical timing windows, leveraging significant gas bids just before and after block creation to outcompete other builders and capture maximum MEV rewards.
Next, we will show more builders’ bidding patterns to foster a more balanced and resilient blockchain environment.
Visit DeFi Strategies Case Studies by EigenPhi or bit.ly/head-first-defi to learn more trading tactic analyses.
Follow us via these to dig more hidden wisdom of DeFi:
EigenTx | Website | Discord | Twitter | YouTube | Substack | Medium | Telegram


