
EVM Chains Demystified: Harness the Power of Visualizers for Free
Unlock Your Trading Potential with Real-Time Tracking, Anomaly Detection, and Predictive Analysis


In the rapidly evolving world of blockchain technology, staying ahead of the curve is no easy task. The complexity of Ethereum Virtual Machine (EVM) chains, the sheer volume of transactions, and the intricate web of smart contracts can often feel like trying to read a book in a language you don't understand. But what if there was a tool that could translate this complexity into something more manageable, even intuitive? Enter the visualizer, a game-changer in the world of blockchain technology.
A visualizer is not just a tool; it's your guide, your detective, your coach, and your crystal ball, all rolled into one. It simplifies complexity, detects anomalies, analyzes performance, educates, tracks transactions in real-time, identifies MEV opportunities, democratizes blockchain, and even predicts future trends.
Let's dive deeper into each of these aspects to understand how a visualizer can revolutionize your blockchain experience.
Complexity Simplified: Navigating EVM chains without a visualizer is like trying to read a book in a language you don't understand. EVM chains handle thousands of transactions every minute, and visualizing these transactions translates the complex language of blockchain transactions into a visual format that's easy for anyone to understand.
Take a look at this case in which EigenTx combined 3 transactions of MEV Blocker into one chart.
Detect Anomalies: Having a visualizer is like having a detective on your team. It can help detect anomalies in transactions that might otherwise go unnoticed. For instance, a user once noticed an unusual spike in transaction volume on a visualizer, which turned out to be an early sign of a bug, or something worse, in a smart contract.
Performance Analysis: Visualizing transactions is akin to a sports coach analyzing game footage. Users can analyze the performance of different smart contracts, spotting inefficiencies or bottlenecks, much like a coach identifying weak points in their team's play.
Ever heard of Jaredfromsubway.eth? EigenTx helps to gauge its performance.
Educational Tool: Remember the first time you saw a globe? Suddenly, geography made a lot more sense. That's the kind of "aha" moment a visualizer can provide for someone new to blockchain technology. They provide a visual representation of how transactions work, making the learning process more engaging and intuitive.
No matter whether you are a beginner, a power user, or an expert, we have unique features for your needs.
Real-Time Tracking: Visualizers allow for real-time tracking of transactions, much like tracking your pizza delivery. This means users can watch their transactions move through the EVM chain in real-time, providing a level of transparency that's as satisfying as seeing your pizza make its way to your front door.
Combined with EigenPhi’s MEV live stream, you can follow the newest MEV transactions.
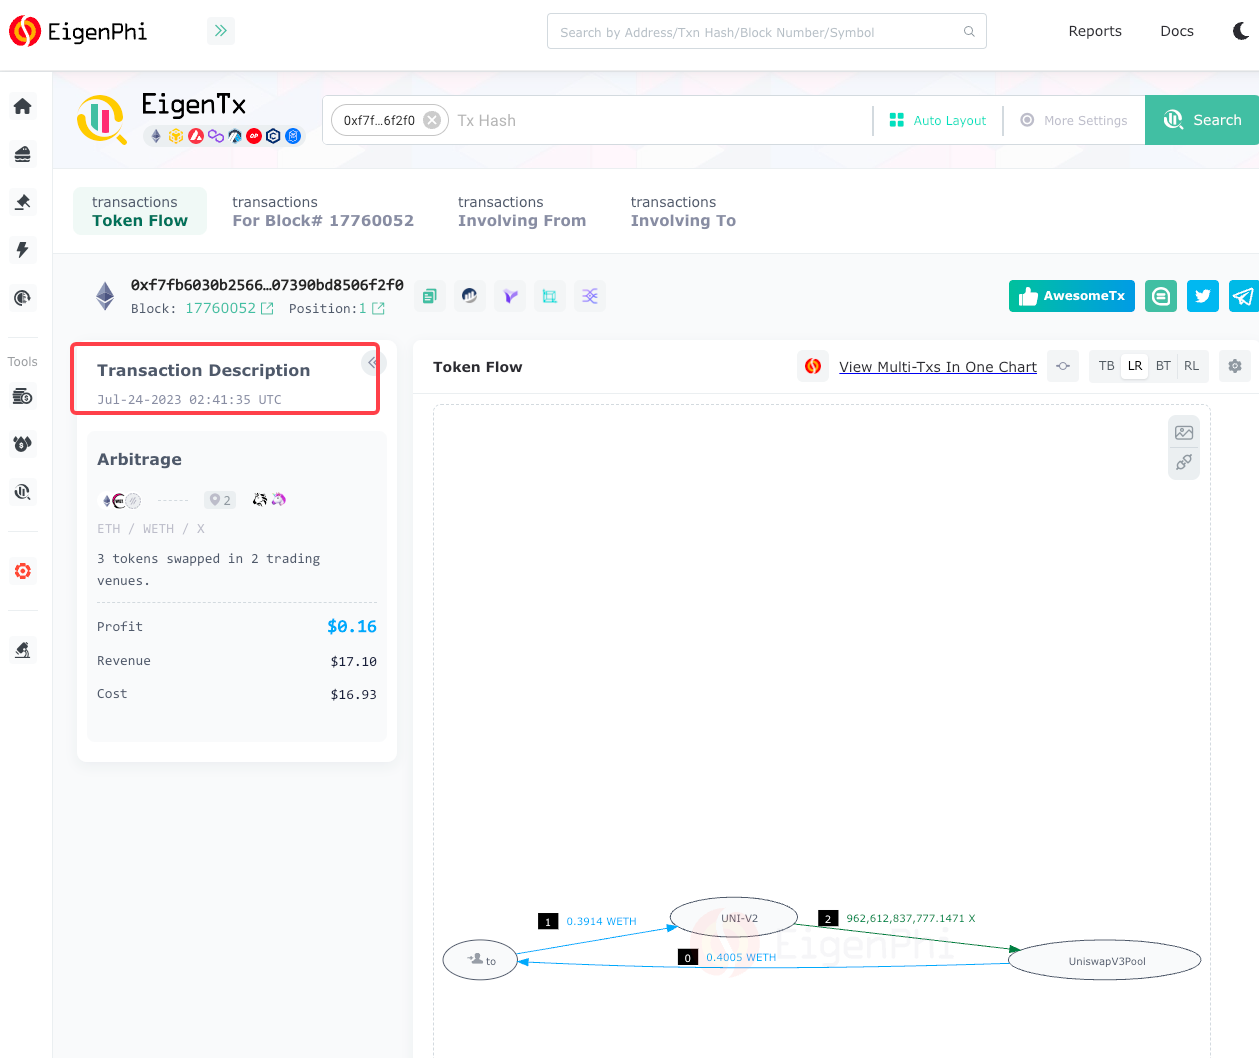
MEV Opportunities: Using a visualizer is like being able to spot a gold nugget in a river because you have a special pair of glasses. It can help identify Miner Extractable Value (MEV) opportunities that would otherwise be hidden in the flow of transactions.
This arbitrage below is the biggest MEV during the last 24 hours, shown here in EigenTx, detailing every transfer step by step.

Democratizing Blockchain: Visualizers are like opening a once-exclusive club to everyone. By making transactions on EVM chains more accessible and understandable, visualizers are democratizing blockchain technology, opening up the world of blockchain to a much wider audience, much like the internet did for global communication.
EigenTx is a free-to-use tool for everyone in the crypto community. Its Chrome Extension seamlessly embeds token flows on detail pages of EVM-scans.
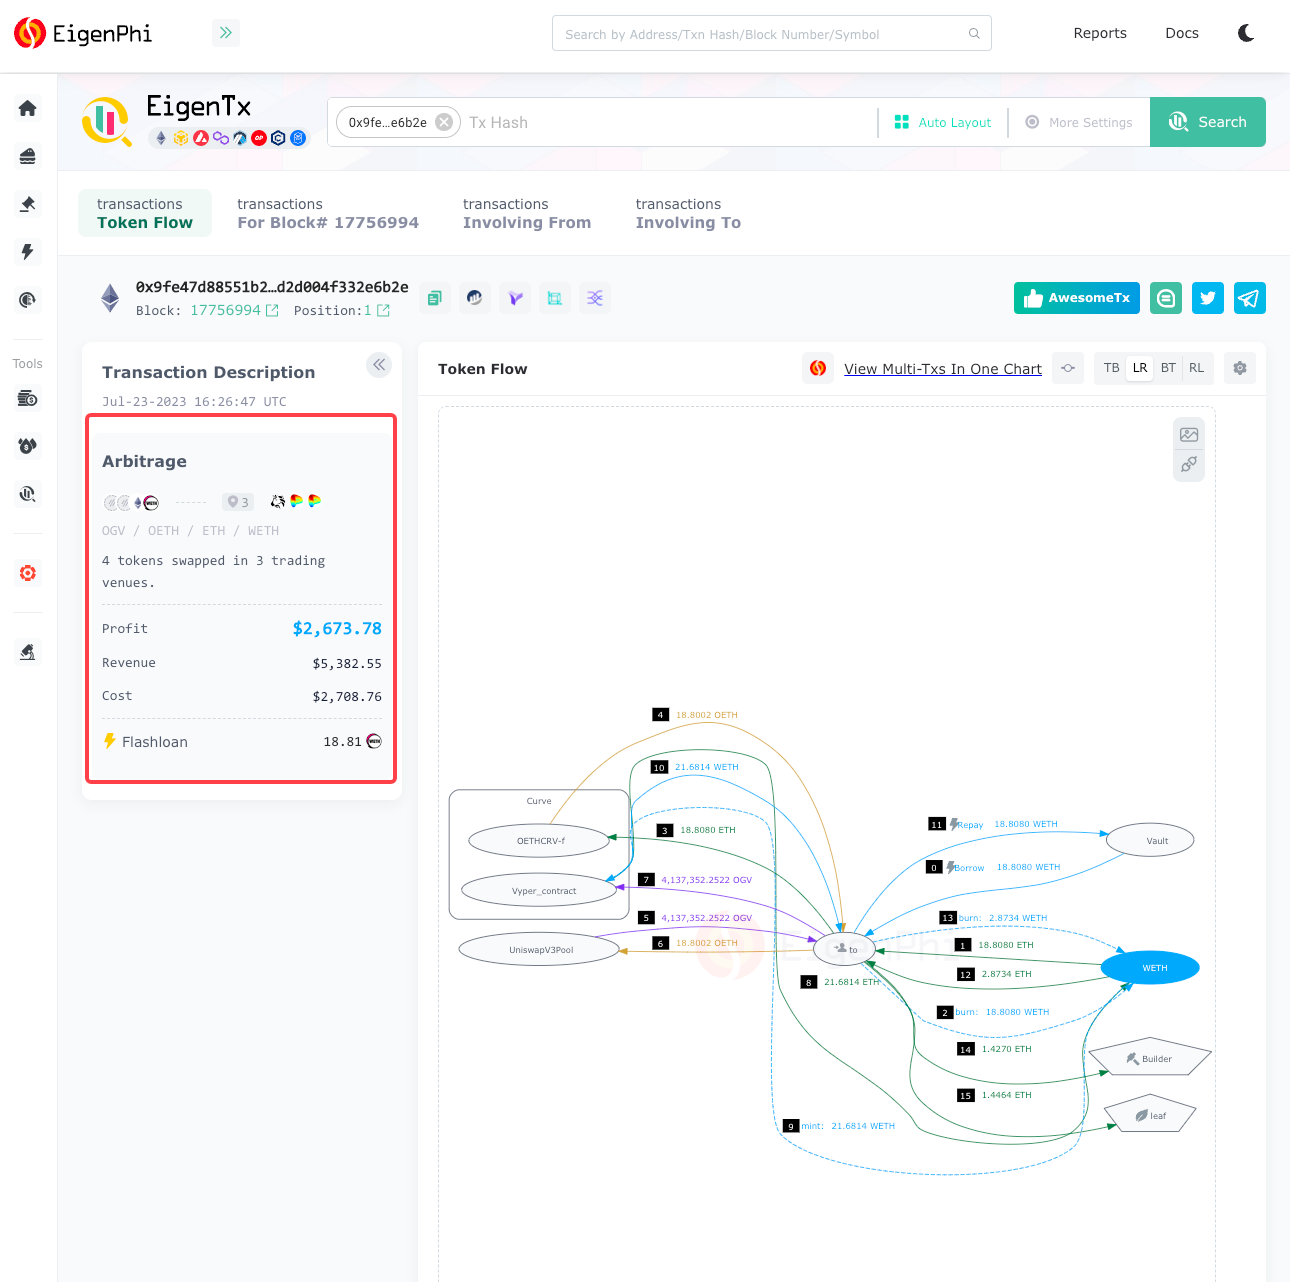
Predictive Analysis: Having a visualizer is like having a crystal ball for the blockchain. Advanced visualizers can even help with predictive analysis, using past transaction data to predict future trends. For instance, by analyzing past transaction patterns, a visualizer might predict an upcoming surge in demand for a particular token, giving traders and investors valuable insights to inform their decisions.
This guy made a 100x-return Russian-doll style MEV arbitrage with trading synthetic tokens. Check out the step-by-step guide.

In the vast and complex landscape of blockchain technology, a visualizer is your compass, guiding you through the intricate maze of transactions and contracts. It's not just a tool, but a powerful ally that empowers you to navigate the world of EVM chains with confidence and ease.
From simplifying complex data to detecting anomalies, from real-time tracking to predictive analysis, a visualizer opens up a world of possibilities. It's like having a personal guide, a detective, a coach, and a crystal ball, all at your fingertips.
As we continue to explore and innovate in the blockchain space, tools like visualizers will play an increasingly crucial role in democratizing blockchain technology, making it accessible and understandable to all. So whether you're a seasoned trader, a budding investor, or a curious enthusiast, embrace the power of visualization and unlock your full potential in the world of blockchain.
Remember, in the world of blockchain, knowledge is power, and a visualizer is your key to that power. So go ahead, unlock the future, and step into a new era of blockchain technology.
Follow us via these to dig more hidden wisdom of DeFi:
EigenTx | Website | Discord | Twitter | YouTube | Substack | Medium | Telegram