USDC Depegging: Victims, Signals, and Opportunities
And the data that would give you a heads-up of such event.
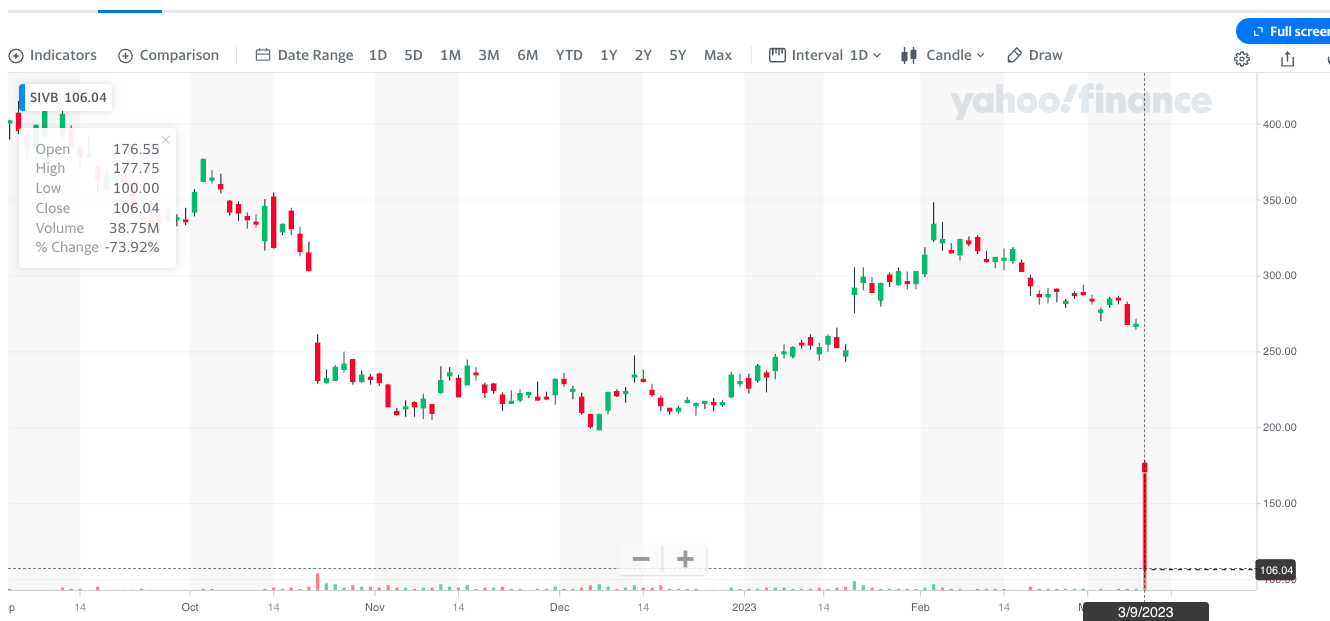
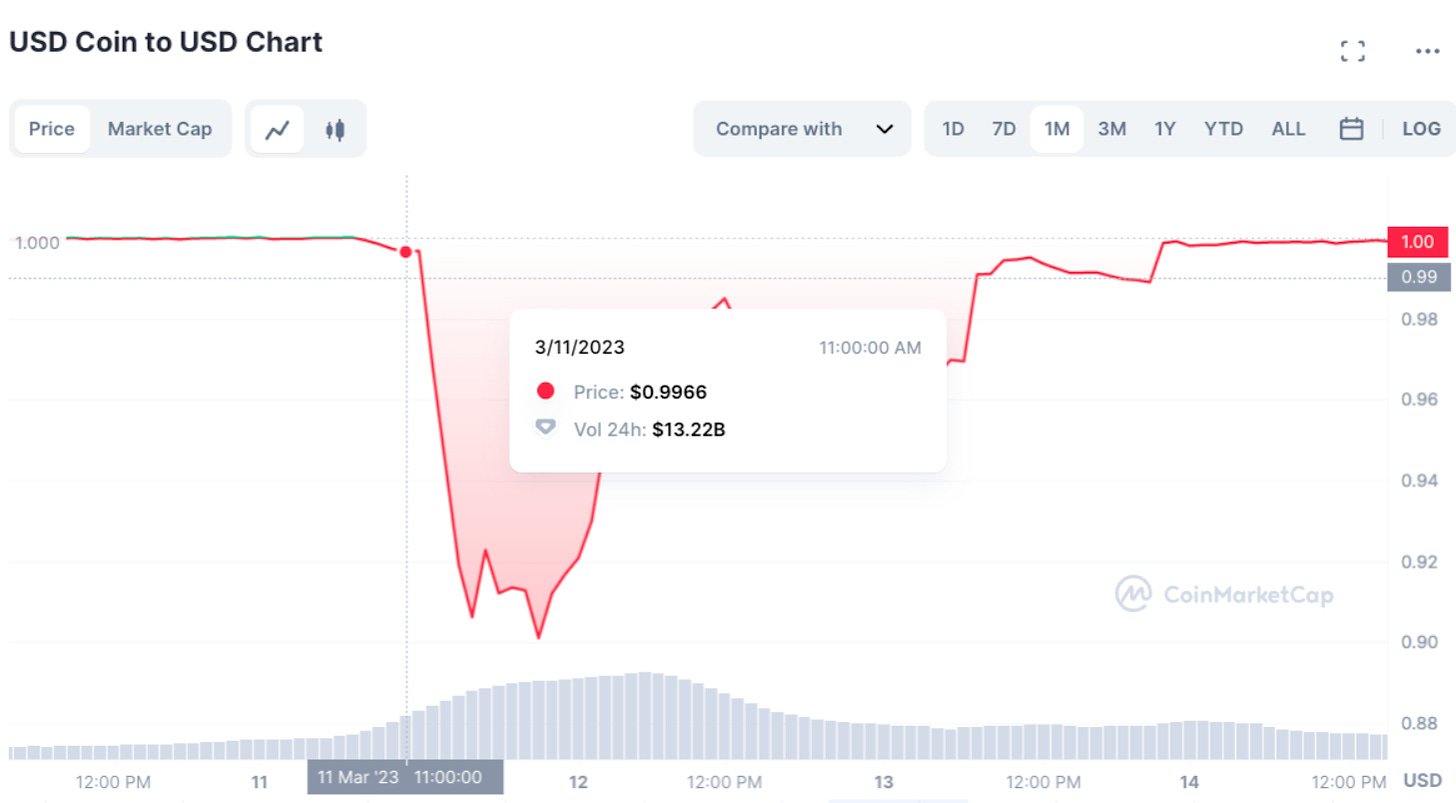
On March 9, 2023, the stock price of SVB Silicon Valley Bank plummeted by 60%, and trading was halted on the following day. Circle, which issued the stablecoin USDC, confirmed it had $3.3 billion in deposits at SVB. The market panicked, and on March 11th, USDC broke its peg to the dollar. Later, the U.S. government announced protection for depositors' assets and gradually restored confidence in the market. USDC returned to its original value of $1 after about three days of depegging.
This post examines several noteworthy events and transactions during the upheaval.
At 3:11, 2023/3/11, UTC, Circle confirmed its deposit in SVB in a tweet:

Had Circle’s $3.3 billion been wholly lost, it would have impacted the value of USDC. However, this amount only accounts for 8% of its total funds; at that time, there was still a possibility of rescuing SVB.
Unfortunately, several factors exacerbated the depegging of USDC:
Psychological factor. UST’s collapse in 2022 left a lasting impression on the market.
CEX, i.e., Coinbase and Binance, temporarily suspended the exchange of USDC, causing a lack of liquidity.
A large amount of USDT flowed from DEXes, such as Curve’s USDT/USDC/DAI 3pool.
The tweet of Circle catalyzed the reaction in the market, causing the depeg of USDC, shown in the chart from CoinMarketCap:
A $2-Million-Loss Transaction
Twenty minutes after the announcement from Circle, while the panic was spreading all over the market, a dramatic transaction came to the scene. A poor guy lost almost $2 million in a single swap trade under pressure.
You can read this post for more details.
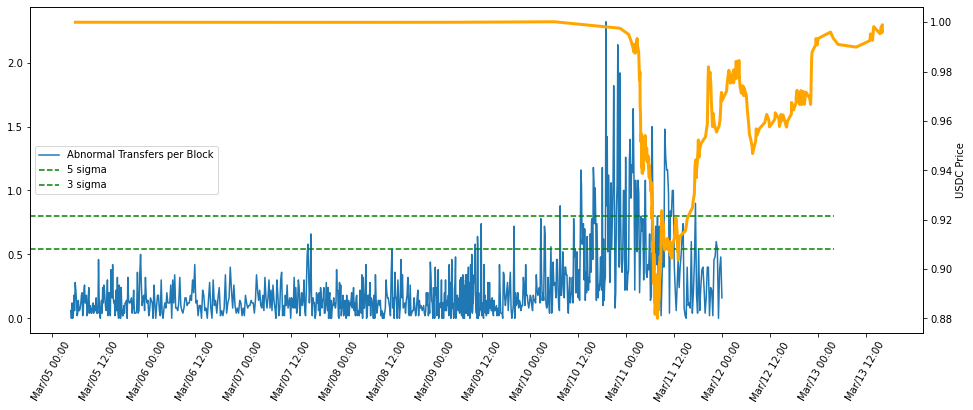
People may argue that the tipping point is Circle’s tweet. However, after reviewing the data, EigenPhi observed that there had been on-chain clear signs showing the liquidity of USDC undergoing drastic changes, which had occurred more than eight hours before the time of depegging.
Large Transfers of USDC
We calculated the average number of large USDC transactions per block over the past 50 blocks (approximately 10 minutes) at each moment before Circle’s tweet. Then we plotted it over time, as shown by the solid blue line in the following graph. Putting it together with the USDC price (solid orange line), we found anomalies had already occurred before the USDC price depegged.
Anomaly of Curve’s 3pool
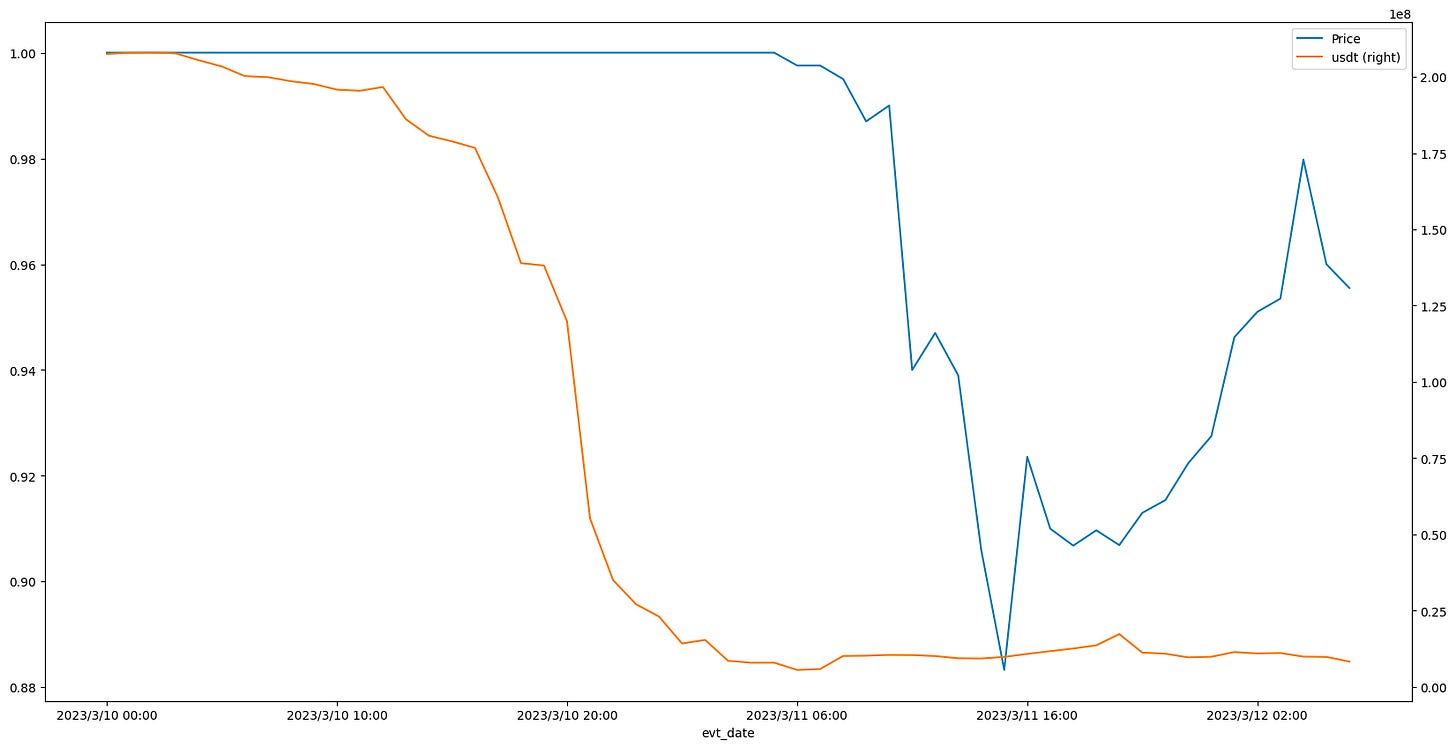
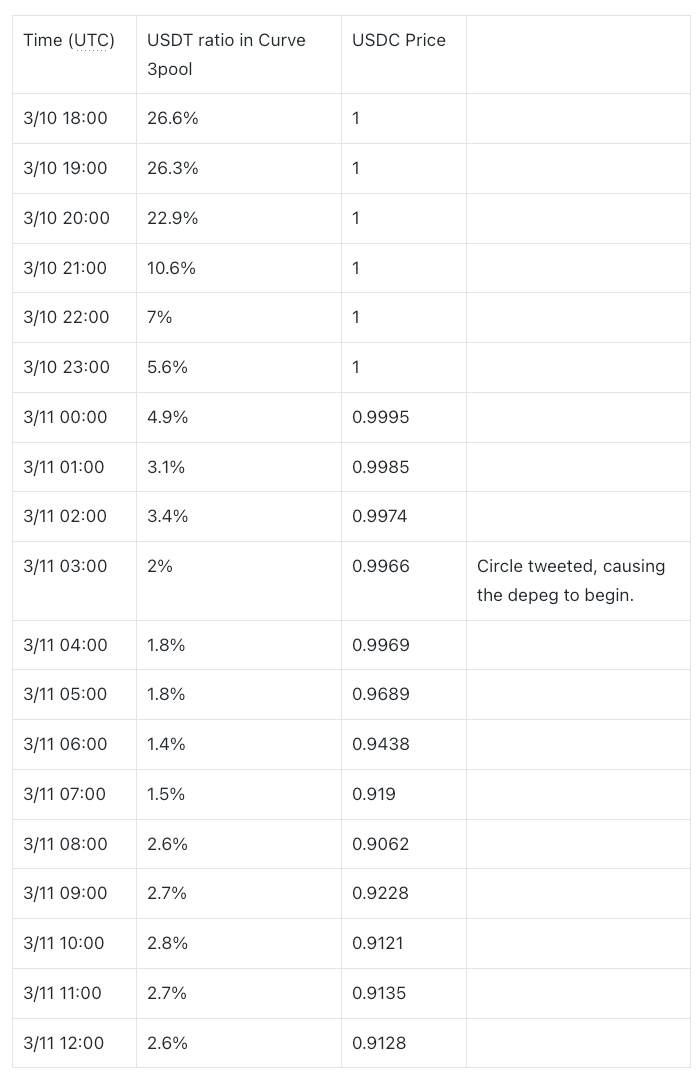
Curve.fi’s 3pool (USDC/USDT/DAI) is one of the most crucial liquidity pools supplying USDC. Before the depegging, its currency reserves had been overhauled with massive USDT withdrawals starting from 8 pm March 10 UTC.
The table below examines the USDT’s reserve ratio in the 3pool.
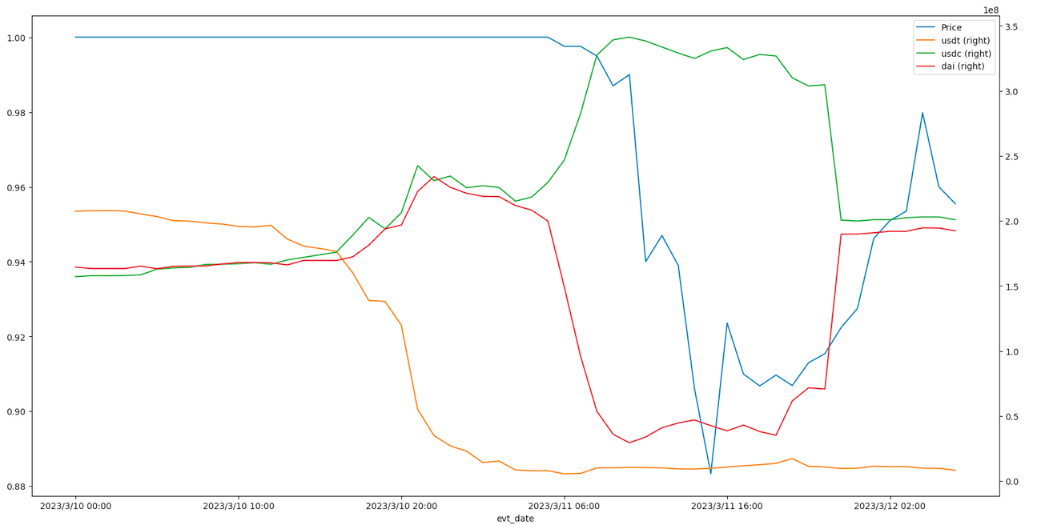
Here is the proportion trend of USDT/USDC/DAI assets in the 3pool with the price:
Many smart traders have already sniffed out the danger and taken action ahead of time in SVB's collapse.
MEV Feast During USDC Depeg
Market volatilities always present many MEV opportunities.
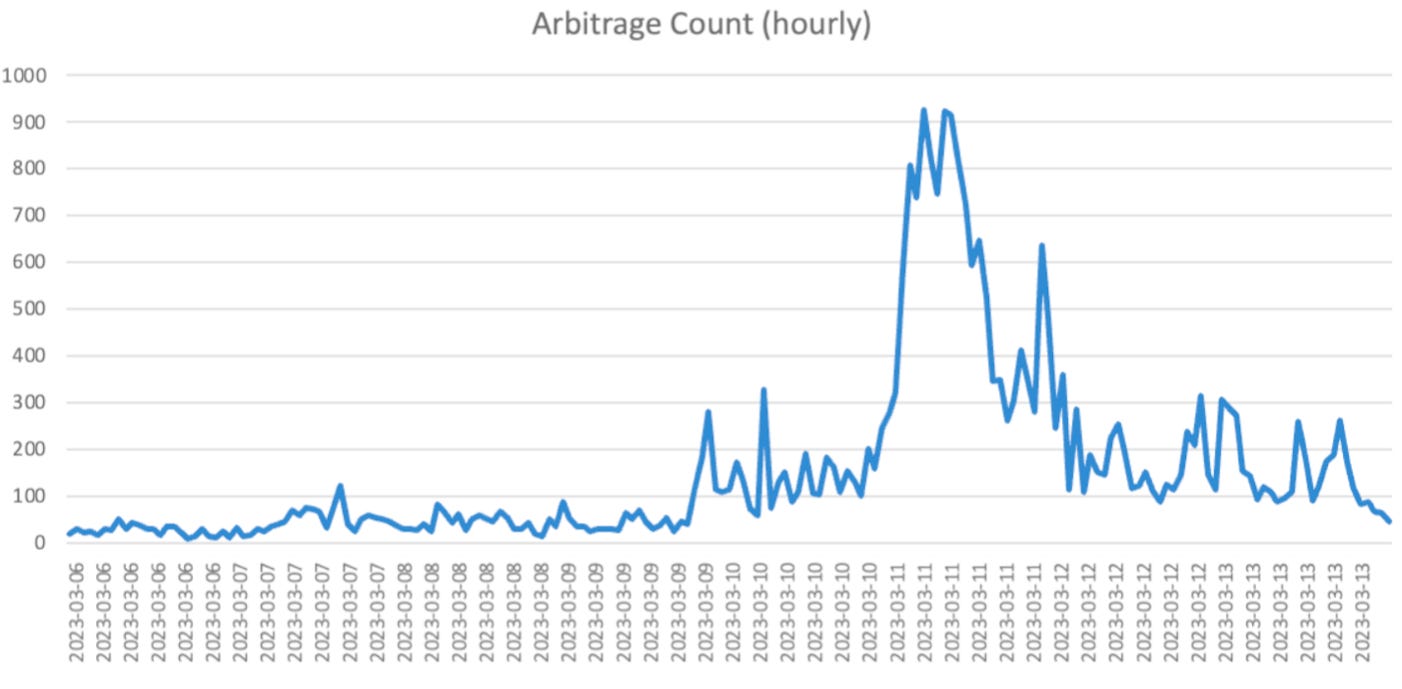
EigenPhi.io monitored frequency changes of arbitrage trades related to USDC on the Ethereum chain. We observed a significant increase in such trades in the 10 hours leading up to the depeg and the peak during the depeg period.
The rise in the arbitrage quantity signaled an uptick in price disparities. USDC’s price had already begun displaying abnormal behavior before depegging.
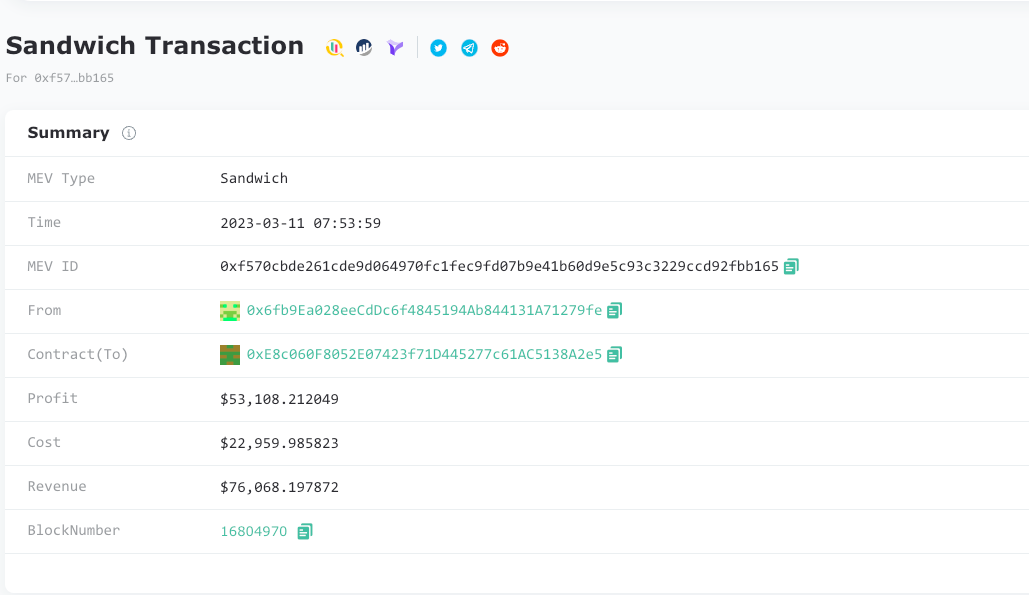
On 12:53 pm March 11 UTC, a huge sandwich ripped the trader off $76K. Here are the token flows.
To manage the attack, the attacker tipped the builder with 14 ETH to reap a profit of $53K.
On March 11, the overall volume of arbitrage reached $4.15 billion, while sanchwich’s volume was a whopping $10.9 billion.
Read Signals, Not Tea Leaves
USDC’s short-time depegging is the ripple effect of U.S. financial system risk. There is a process brewing for this kind of violent market volatility, generating and spreading shocking waves everywhere. By the time the public becomes aware, there have already been some signs indicating the occurrence of the shock. So if you don’t want to be a victim next time or even wanna move ahead, watch out for these signals:
An increase in the number of abnormally large transactions
Dramatic changes in asset liquidity flow in important Liquidity Pools
Changes in related arbitrage quantities
Follow us via these to dig more hidden wisdom of DeFi:


