Introduction
CoW Swap is the first trading interface built on CoW Protocol[1]. CoW Swap is a decentralized exchange that allows users to swap tokens on the Ethereum blockchain. It is on top of the CoW Protocol, a set of smart contracts that implement the rules and logic of the exchange. The CoW Protocol is designed to be a decentralized, trustless platform for exchanging tokens, which means that it does not rely on any central authority or intermediaries to facilitate trades. Instead, it uses a network of solvers to automatically execute trades based on predefined rules, ensuring that the process offers the best possible price for the users.
The unique name 'CoW,' commonly referred to as 'Coincidence of Wants', is the method that the protocol employs to match the transactions of its users. Unlike current decentralized exchanges (DEXs), where liquidity comes from liquidity providers, CoW Swap uses batch auctions to match orders as the primary trading mechanism:
CoW Swap prioritizes matching user orders directly before using external liquidity. For instance, if two users want to trade assets on CoW Swap, with one selling and the other buying, the platform will match their orders directly. This user order matching eliminates the need for market makers or liquidity providers to match transactions using on-chain liquidity.
CoW Swap matches unsettled orders through CoW using external liquidity on-chain via automatic market makers (AMMs).
Cow Swap's order matching design is 'MEV-resistant,' meaning traders on the platform don't need to worry about potential losses caused by front-running. This characteristic is due to two reasons:
Firstly, uniform pricing within batch orders fundamentally resolves the MEV sandwich issue. There is no concern with transaction ordering because the trading interface matches directly between peers.
Secondly, for the remaining orders that need automatic market makers (AMM), Cow Swap introduces the concept of a 'Solver.' This third party helps users find the optimal transaction route on the chain through competition. Solvers set a very tight slippage and can employ sophisticated technologies that typical users cannot leverage. This ability allows them to assist users in obtaining the best possible price, leaving little room for sandwich bots to profit.
We conducted comprehensive research on the impact of sandwich attacks on CoW Swap to evaluate how the platform's design resists MEV. This research aims to help traders and designers on CoW Swap, as well as users, researchers, and designers from other decentralized exchanges, address the following questions:
What is the impact of MEV sandwich attacks on CoW Swap?
Which solvers are more vulnerable to these sandwich attacks?
How can the data help solvers develop more effective transaction-matching strategies?
The analysis will focus on sandwich attacks on CoW Swap trades. We selected all transactions initiated by the CoW Swap settlement and filtered those under attack from sandwich attackers. The report will begin with a summary of our discoveries during the investigation. We will then provide an overview of the MEV revenue (solver's loss), volume, frequency analysis, and profit. Finally, we will delve deeper into attacked solvers and attacked contracts, with some inspiring conclusions.
Key Takeaways
In 2022, approximately 1.9K sandwich attacks targeted CoW Swap trades. With 239K transactions, sandwich attacks only accounted for about 0.8% of the total trades on CoW Swap.
Sandwich attacks extracted roughly $0.13 million from CoW Swap solvers. Compared to CoW Swap's total fee revenue of $8.55 million, sandwich attacks only accounted for around 1.5%.
Through CoW Swap, the percentage of attacks is one magnitude lower than the total sandwich attacks percentage in Uniswap or Curve. In addition, compared to other DEXs, as shown in our MEV Annual Report, the volume of CoW Swap batched value attacked was only 0.7% of the total volume, also one magnitude lower than other DEXs.
When comparing the impact of the sandwich attack on different aggregators (1inch, Matcha, and Cowswap), data shows that trades through Cowswap were the least exploited, which was observed not only in terms of the percentage of trades under attack but also in terms of the percentage of the exploited volume.
After The Merge, there is an increase in both sandwich counts and the volume of sandwiched trades. Attacks on solvers are more frequent after The Merge, but several also avoid sandwich attacks.
The most exploited contracts are Uniswap V3 and Uniswap V2. CoW Swap has used several protocols to match orders and avoid sandwich attacks.
1. Overview of the Sandwich MEV Impact on CoW Swap
1.1 Percentage of CoW Swap Trades Under Attack in 2022
We first investigated the proportion of CoW Swap trades that suffered sandwich attacks in 2022. Our findings revealed that approximately 1.9K sandwich attacks targeted CoW Swap trades during that period. Compared to the total number of CoW Swap trades, which amounted to 239K transactions, the percentage of sandwich attacks on CoW Swap in 2022 was relatively low, at around 0.8% of the total trades.
1.2 Total Extracted Value That Sandwich Attackers Have Gained From CoW Trades
The total value extracted from sandwich attacks on CoW Swap solvers is approximately $0.13 million. Compared to CoW Swap's total fee revenue of $8.55 million, sandwich attacks only constituted around 1.5%.
Before The Merge on September 15th, the revenue extracted from CoW Swap solvers was relatively low. However, it's worth noting that after The Merge, attackers drained revenue from CoW Swap solvers at a higher speed.
1.3 Comparison of Sandwich Impact on CoW Swap With Uniswap and Curve
Our earlier research investigated the MEV impact, including sandwich attacks, on Uniswap and Curve. Our findings revealed that Curve experienced less of a sandwich impact than Uniswap.
CoW Protocol is a fully permissionless trading protocol that leverages Batch Auctions as its price-finding mechanism. CoW Protocol enables batch auctions to maximize liquidity via Coincidence of Wants (CoWs) in addition to tapping all available on-chain liquidity whenever needed. The primary interface to interact with CoW Protocol is the somewhat MOO-famous UI, CoW Swap. Since CoW Swap does not have liquidity pools for its order batching and whenever there is no overlap between traders' liquidity, solvers have to find the best solution to trade on different pools through other DEXs, including Uniswap and Curve. To compare the sandwich impact and assess CoW Swap's MEV resistance, we analyzed the total number of trades that CoW Swap batched through Uniswap and the number of times those trades suffered sandwich attacks in Uniswap through CoW Swap. We also examined the total number of transactions conducted on Uniswap pools and the number of those transactions that suffered sandwich attacks by MEV, applying the same logic for Curve. Here are the comparison results:
In 2022, CoW Swap executed approximately 282K trades through Uniswap. 1.3K of these trades suffered sandwich attacks in Uniswap pools. The percentage of attacks is 0.047%. In contrast, Uniswap had 39.6M trades in 2022, with attacks on 0.5M. The rate of trades attacked is 1.26%. Therefore, through CoW Swap, the percentage of trades attacked was one magnitude lower than in Uniswap.
The conclusion is similar to Curve. As we mentioned earlier in our research, we found Curve experienced less sandwich impact than Uniswap, with a lower proportion of trades affected by sandwich attacks. The percentage of Curve's transactions attacked was 0.4%, whereas the rate of attacks on Curve's transactions through CoW Swap is also much lower, at 0.14%.
2. Revenue of Sandwich MEV Searchers by Attacking CoW Swap Trades
2.1 Revenue Drained From Solvers (But Not CoW Swap Users) Versus CoW Swap Fee Revenue
The revenue that sandwich attackers drained from CoW Swap solvers directly impacts the platform's fee revenue. It’s because solvers help users fill their limit orders, and the more revenue attackers get, the less fee revenue CoW Swap will receive.
As we can see from the revenue trend chart below, the revenue extracted from solvers remained relatively small compared to the total fee revenue before The Merge.
After the Merge, the revenue drained from CoW Swap became more significant, as shown in the enlarged data below. The revenue drained accounted for 13% of the platform's fee revenue, a considerable loss for solvers to consider.
It is important to highlight that in the case of CoW Protocol and CoW Swap, these losses accrued from MEV only affect the solvers and not the end users. It is because the solvers agree and commit to the users on the price they signed; thus, if the price is not obtainable, the solvers batch does not execute. But, if the price is obtainable, and the solvers get MEV, the users still perceive the amount they agreed on, and the solver simply gets less output.
2.2 Revenue Distribution
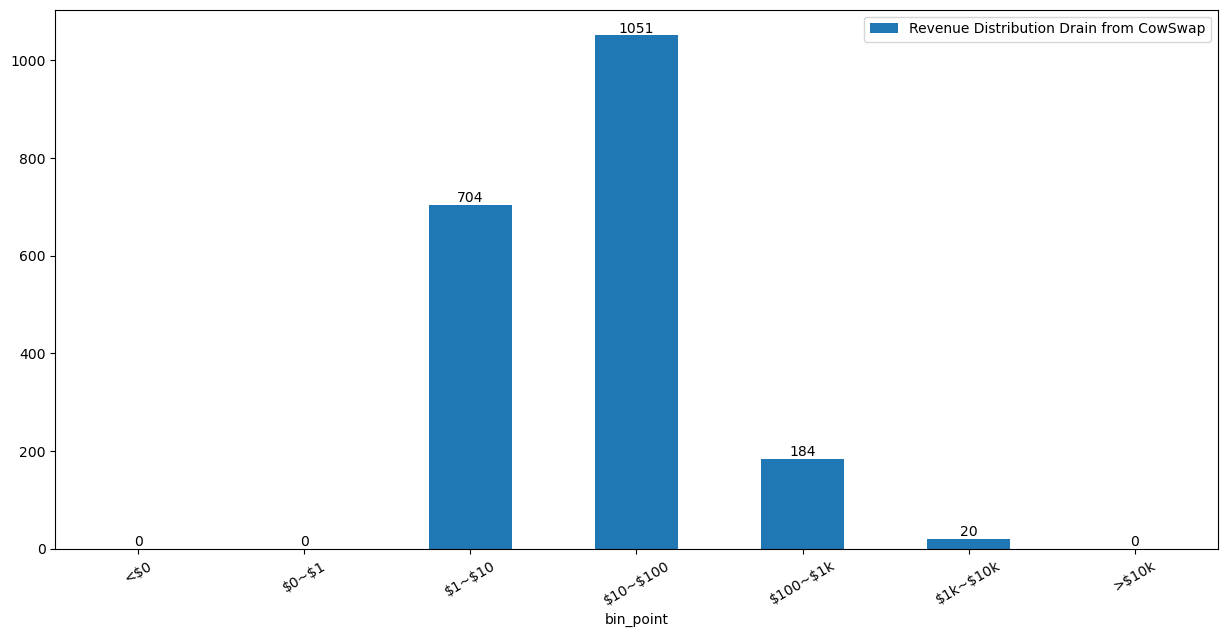
Most sandwich attacks on CoW Swap generate less than $100, with very few attackers earning between $1K and $10K. There have been no attacks producing more than $10K. The largest attacks that generated the highest revenue used 1091 WETH to exchange for more than 1 million USDC, while the solver tried to match the order in Uniswap with 415 WETH to exchange for 0.49 million USDC. This attack drained 8.6K from the solver.
It is likely why we haven't seen any attacks generating more than $10K in revenue. Even though attackers want to maximize their profits, they must balance the slippage they initiate and the potential profit they can generate. If the slippage they push is too high, the solver's transaction may roll back since they set a tight slippage bond.
3. Sandwich MEV Frequency Analysis
The frequency analysis of CoW Swap sandwich attacks reveals how often sandwich bots attack the platform. While we identified CoW Swap sandwiched trades based on the minimum set, comparing the data over time provides valuable insights. The analysis includes daily observations and the frequency of attacks by each attacker over time.
3.1 Daily Observations Trend of Sandwich MEV Attacks on CoW Swap Trades in 2022
The percentage of CoW Swap trades suffering from sandwich bot attacks has been relatively small. Still, the daily frequency of such attacks increased significantly after The Merge. The chart below highlights that the total number of CoW Swap trades remained relatively stable throughout the year, but the number of trades attacked by sandwich bots increased substantially post-Merge, with at least three attacks per day and 63 attacks per day during the month when FTX crashed.
Before The Merge, most days saw no sandwich attacks as the dominance of Flashbot MEV Geth in the mining sector. It showed little room for sandwiching if CoW Protocol settlements were submitted through Flashbots Protect directly.
After the merger, since the block-building market opened up to more players not using Flashbots software, CoW Protocol started submitting settlements directly to the mempool, thus opening up the door to more sandwiching at the cost of having the settlements included in a block faster.
3.2 Frequency of Attacks for Each Attacker Along the Timeline in 2022
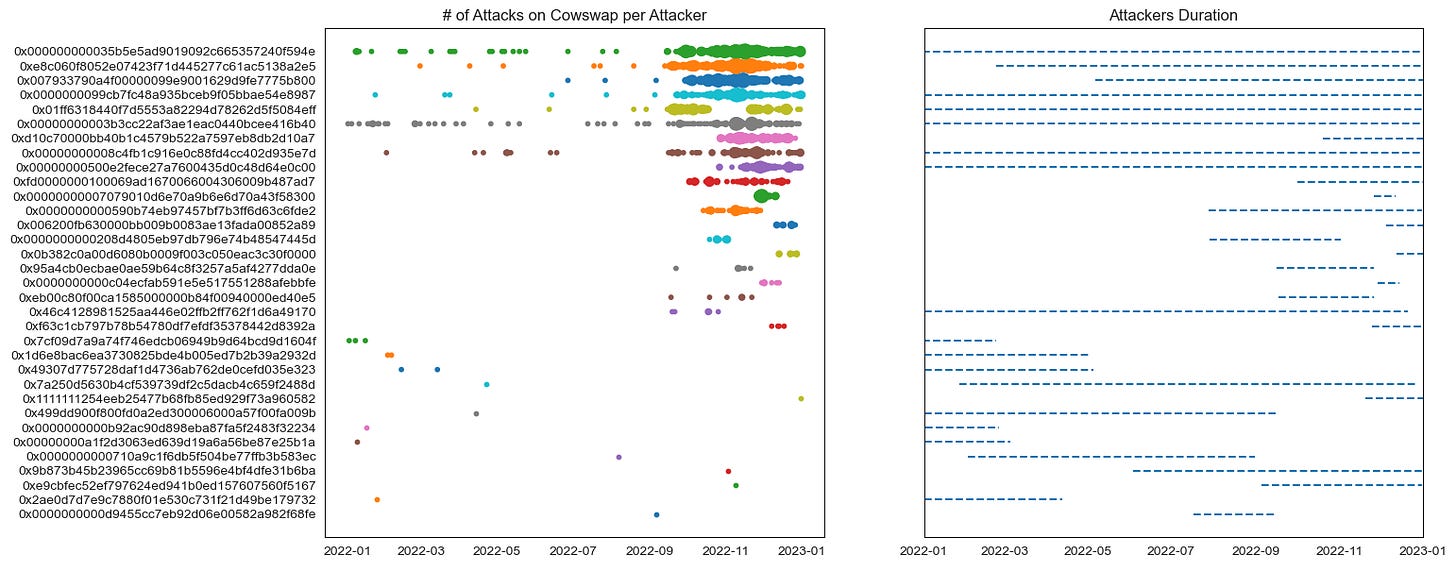
To gain a deeper understanding of the issue of attack frequency before and after The Merge, we analyzed the timeline of attack frequency for each attacker, as shown in the chart below:
The data points in the chart represent the number of times each attacker targeted CoW Swap trades per day, with point size indicating attack frequency. A larger point size means more attacks by the corresponding attacker on that particular day. The chart on the right shows the duration of each attacker's attacks in 2022, from their first attack date to their last attack date of that year. The horizontal lines represent this information on the chart.
We observed a total of 33 attackers targeting CoW Swap trades. Among these attackers, the top 10 bots showed a higher concentration of attack frequency after The Merge. While two bots emerged after the Merge, the other attackers mostly appeared at the start of the year or before 'The Merge' and increased their attack frequency on CoW Swap solvers after the Merge.
In the following section, we found that these attackers did not focus their attacks on a single solver but instead distributed them across several solvers.
We can attribute the increase in attack frequency by these attackers on CoW Swap trades after The Merge to different reasons. One potential reason is the transition from Proof of Work (PoW) to Proof of Stake (PoS) in Ethereum, which introduced a new actor into the system - block builders. Mempool dynamics incentives block builders to construct the most profitable blocks for approval by validators. This game theory creates an environment where MEV becomes a significant source of incentives, and the introduction of MEV-Boost relays also makes MEV more accessible and equitable.
We also found a similar phenomenon in the total sandwich trend in 2022. As shown in the chart below, the total sandwich count on Ethereum increased after The Merge, indicating more available opportunities.
4. Cost/Profit of Sandwich Attackers That Attack CoW Swap Trades
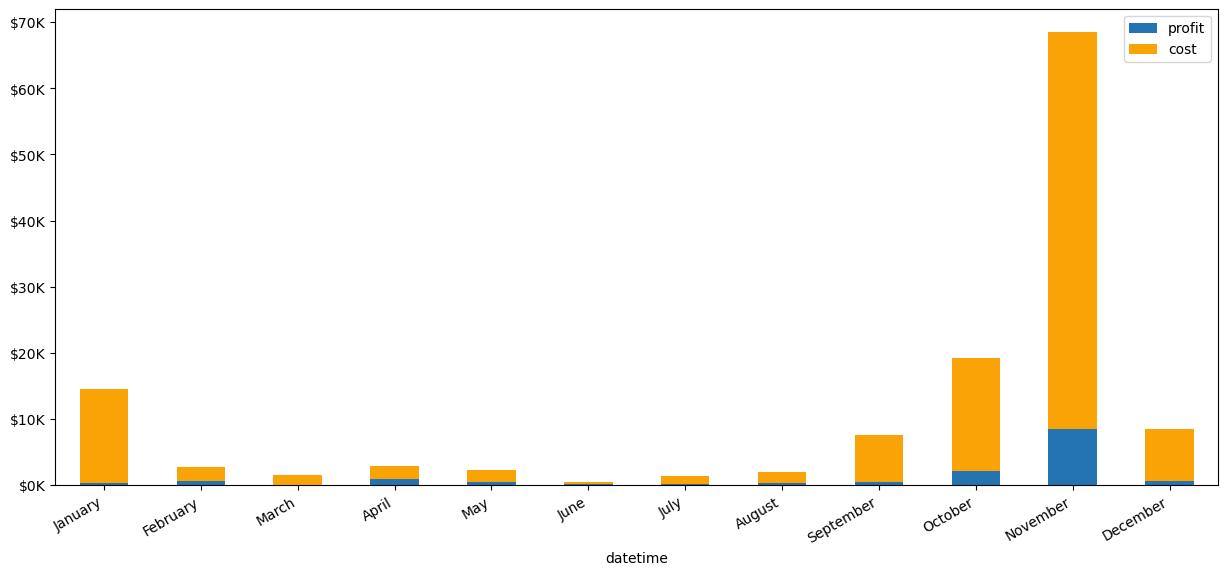
4.1 Monthly Trend of Profit and Cost of Sandwich Attackers on CoW Swap
Most of the revenue from sandwich attacks goes to block builders and validators, resulting in less profit for the sandwich bots. However, in November, revenue spiked due to the highest levels of total trades on CoW Swap and sandwich trades during the FTX crash.
4.2 Profit Distribution of CoW Swap Sandwich Attackers
Most attacks generate profits below $10, and no attackers can produce more than $1K in profit. Due to the relatively small financial gain associated with these attacks, they may be less appealing to potential attackers.
5. Sandwich Volume Analysis
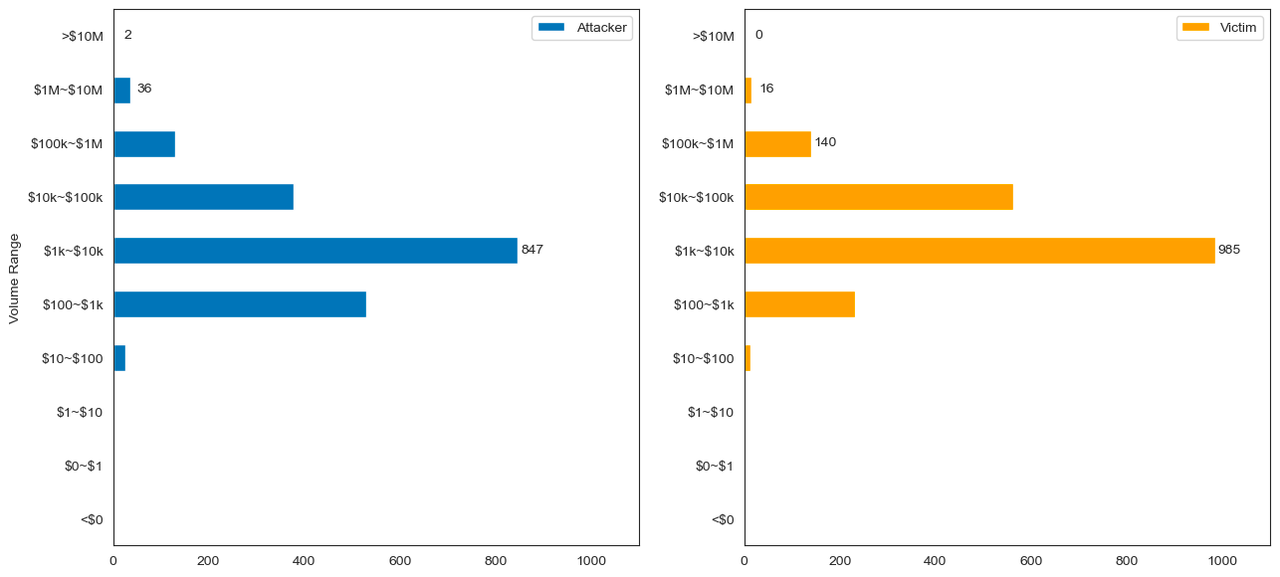
The volume analysis of CoW Swap trades attacked is an important metric to evaluate the impact of sandwich MEV. It is because the attacker's volume significantly influences the price slippage of liquidity pools, which is the core of the sandwich attacks. Therefore, this section provides a statistical overview of the volume for both attackers and victims (CoW Swap solvers) and the volume distribution and correlation between the volume and the solver's loss.
To calculate the volume, we filtered out the CoW Swap trades under attack and further filtered based on the liquidity pools where the attack occurred. Then, we considered the trading volume of that liquidity pool that the CoW Swap solver used to batch orders as the victim's volume. We also calculated the attacker's volume on that liquidity pool using the same logic. This report converted the final output of the volume in USD, and we used our latest price index service to compute the token price.
Out of CoW Swap's total batched value of $14.5 billion, only $0.1 billion in volume was affected by sandwich attacks, which accounts for approximately 0.79% of the total volume. This finding, combined with the earlier figures on the number of attacked trades, suggests that the impact of sandwich MEV on the CoW Swap is relatively low.
5.1 Daily and Monthly Trend of the Sandwich Volume on CoW Swap
Since The Merge, the volume of CoW Swap trades has increased, and there was a peak in the sandwich attack volume on CoW Swap in November after the FTX crash. This trend is consistent with the overall volume trend of sandwich trades during that period.
5.2 Volume Distribution of CoW Swap Trades Under Attack
Most attacked orders on CoW Swap range between $1K and $10K.
The most minor attacked order on CoW Swap is $46, while the largest is nearly $4.9M, resulting in a loss of more than $2,943 for the victim.
The largest volume of an attacker's attack is $8.7M, leading to a loss of $2,295 for the victim.
5.3 Correlation Between Victim (Solver) Loss and Attacker Volume
We can consider attackers' gains from CoW Swap solvers as the solvers' losses. There is a positive correlation between the attacker's input volume and the loss of the solver.
This chart displays the correlation between the volume of the victim and the attacker, with the size of the scatter indicating the victim's loss. Essentially, attackers tend to input larger volumes when the victim's volume is high, and there is a link between the revenue generated by the attackers and the input volume. Therefore, larger volumes are more susceptible to sandwich attacks.
6. Comparing Sandwich Impact of Different Aggregators
This section compares three aggregators (1inch, Matcha, and Cowswap) and evaluates the sandwich impact on trades these aggregators have batched. The three aggregators utilized different algorithms to assist users in finding the optimal exchange price. Their algorithms have been crafted to give users slippage protection, helping them reduce the chances of being hit by sandwich attacks:
1inch employs two modes: fusion mode and legacy mode, to minimize the risk of front-running and sandwich attacks. Fusion swaps are matched directly by resolvers and grouped with other orders in a bundle to be included in the block, making it hard for bots to target them. And with the introduction of the RabbitHole feature in legacy mode, all swap transactions are sent directly to validators, bypassing mempools where sandwich bots could launch an attack.
Matcha is a user Interface retail product from 0x. For the orders that could be matched directly with Matcha professional market makers, Matcha returns an individualized and slippage-free price quote from them. Once the transaction is signed, market makers will submit the transaction to be verified on-chain and pay for the gas cost. Matcha also provides the 'Slippage Protection' function; if enabled, 0x API’s smart order routing instead attempts to maximize the executed price, which considers any slippage losses instead of solely relying on the best-quoted price.
CoW Swap prioritizes matching user orders directly before using external liquidity. In cases where orders remain unsettled, CoW Swap has incorporated solvers that utilize automatic market makers (AMMs) to locate external liquidity on-chain. These solvers are incentivized to assist users in reducing slippage losses, maximizing their solver rewards.
It would be worthwhile to assess the sandwich impact on trades executed through those aggregators. The data can be instructive in determining what design would be beneficial in mitigating front-running losses caused by sandwich attacks.
We notice that aggregators may route orders to other aggregators during transactions; for example, 1inch may direct orders to Matcha or vice versa. To eliminate the impact of aggregators of aggregators, we filter transactions based on the 'to' contract belonging to either the 1inch or Matcha address and analyze the frequency of sandwiched transactions for each of them. The research timeframe spans the entirety of 2022, and it focuses on transactions conducted on the Ethereum network.
To help the community understand the effects of sandwich attacks, our investigation will focus on the following areas:
Initially, we will assess the proportion of volume and number of counts affected by sandwich attacks on those batched transactions by the three aggregators.
Then analyze the amount of value lost due to sandwich attacks.
Next, we will examine the frequency of sandwich attacks.
Finally, we thoroughly evaluate the volume targeted by the attacks.
By examining the aspects discussed, we can comprehensively understand sandwich attack impacts.
6.1 Proportion of Transactions and Trading Volume Affected by Sandwich Attacks
The total counts on the trades through the three aggregators that have been under attack:
A total of nearly 2.8 million transaction counts were initiated by 1inch addresses (as 'to' address), of which approximately 2.7% under attacked.
Matcha has around 712K total transaction counts, with 1.9% under attack.
Cowswap batched transactions with 284K counts, but only 0.7% of the trades were attacked.
An important aspect of sandwich attacks is that attackers target large trading volumes to generate greater revenue from their victims. Therefore, evaluating the attacked volume is crucial in determining the extent of the sandwich attack. The total volume of the three aggregators in 2022 of Ethereum is generated from Dune(method in section 2):
1inch batched a total volume of more than $100 billion, of which $3.2 billion in trading volume was attacked, representing 3.2% of the total trading volume.
Matcha settled a total of $22 billion in trading volume, of which approximately $1.3 billion was attacked, accounting for 6% of the total trading volume.
Cowswap settled a total of $14.5 billion in volume, with around $0.1 billion being attacked.
Not only in terms of the number of transaction counts but also in trading volume, Cowswap is the least exploited by front-running and sandwich attacks among the three aggregators.
6.2 Revenue Drained From the Three Aggregators
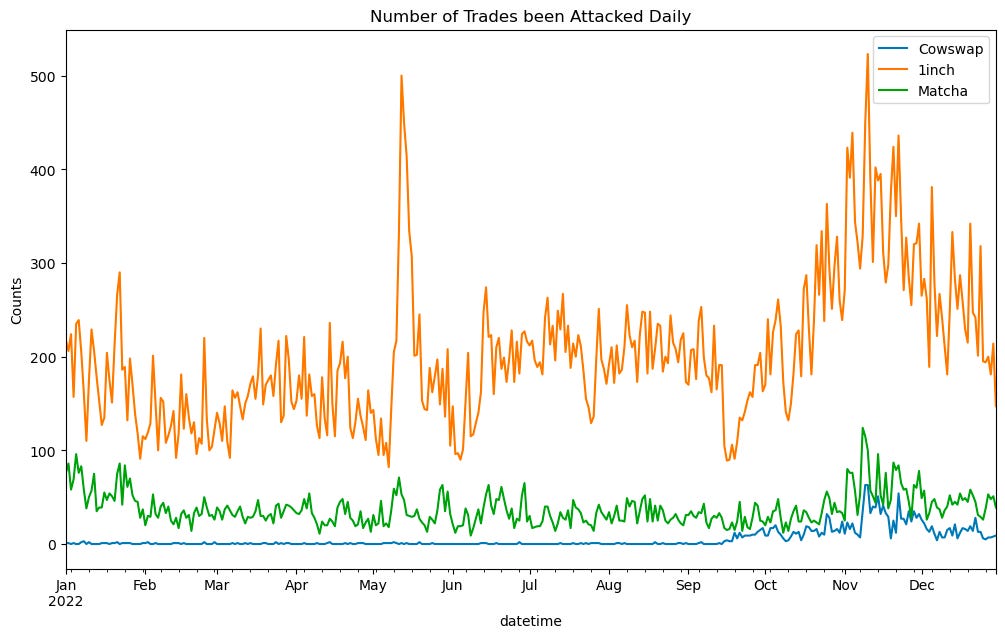
We compared the total attacked volume in the above section: $3.2 billion for 1inch, $1.3 billion for Matcha, and $0.1 billion for CoW Swap. However, it is crucial to investigate the amount of value drained from the trading volume to determine the losses users incur from sandwich attacks. The chart below illustrates the daily and monthly revenue trend of sandwich attackers who drained trades aggregated by 1inch, Matcha, and Cowswap.
Due to being attacked the most in terms of absolute volume and the number of trades, 1inch has suffered the highest loss of value, with a total of $25.9 million extracted. Matcha follows with $6.4 million extracted, while Cowswap has experienced the least value loss, with a total of only $0.13 million, more than one magnitude lower than the other two.
If you look at the revenue trend, 1inch has been drained the most in all months. Due to the Luna crash on May 12th, 1inch experienced a surge in trading volume, which created numerous opportunities for sandwich attackers to exploit. Matcha was drained a lot at the beginning of the year, but this value decreased in the year's second half. While Cowswap has drained the least value overall, there is an increasingly concerning trend in revenue after the Merge.
6.3 Daily Observation of Sandwich Attacks on the Trades Through Aggregators
This section provides a detailed investigation into the number of trades under attack through the three aggregators.
Although 1inch suffered the most attacks on May 12th, the frequency of attacks remained stable before the Merge(Sep 15th). However, there was an increase in the number of attacks after the Merge. Matcha, on the other hand, experienced more attacks at the beginning of the year, with the frequency remaining stable until the FTX crash in November. Before the Merge, Cowswap only faced attacks in single digits, but there was also an increase in the frequency of attacks after the Merge.
6.4 Daily Volume Under Attack Through Aggregators
We have compared the daily volume under attack, and it is evident that Cowswap's victim volume was significantly lower before the Merge. However, there is a noticeable rising trend in Cowswap's attack volume after September, as seen in the monthly volume trend. Overall, the attack volume of Cowswap is significantly less than the other two aggregators.
Upon comparing the volume distribution across the three aggregators, it is observed that the most attacked volume range lies between $100 - $1000. Moreover, when the volume exceeds $10K, trades on Matcha have a slightly higher probability of being attacked than those on 1inch and Cowswap. This may be attributed to Matcha's slippage protection being user-selection based. If users choose to prioritize getting the best quote price over considering potential slippage loss, they may be more vulnerable to front-running attacks.
7. Detailed Investigations Into Sandwich MEV on Solvers
This section provides a detailed investigation into the impact of sandwich MEV on CoW Swap solvers. We will explore the number of solvers affected by these attacks, the frequency of attacks on each solver, and the ranking of the top solvers attacked.
It is essential to highlight that in the case of CoW Protocol and CoW Swap, these losses accrued from MEV only affect the solvers and not the end users. It is because the solvers agree and commit to the users on the price they signed; thus, if the price is not obtainable, the solvers batch does not execute. But, if the price is obtainable, and the solvers get MEV, the users still perceive the amount they agreed on, and the solver simply gets less output.
7.1 Daily Observations of the Counts of Solvers Under Attack
Before The Merge, attackers occasionally targeted only 1 or 2 solvers, and most days saw no solver attacked. However, after The Merge, the daily number of solvers attacked increased. Although over 47 active solvers batch orders on CoW Swap, the maximum number of solvers assaulted in a single day was at most 10.
7.2 Frequency of Attacks for Each Solver Along the Timeline in 2022
We have identified 27 solvers attacked in 2022 based on our data. We ranked these solvers on the left side of the chart below, based on the number of times the attackers targeted them, and displayed the frequency of the attacks in the chart, with the size of each point representing the number of times a solver under attack per day. On the right side of the chart, we displayed the duration of each solver, with the start time of the first batched size and the end time of the last batched size.
Interestingly, the solvers that were among the most frequently attacked after the Merge had also batched orders before the Merge. However, they were not attacked as frequently before The Merge but received more attacks after the Merge.
7.3 Relationship Between Attackers and Solvers
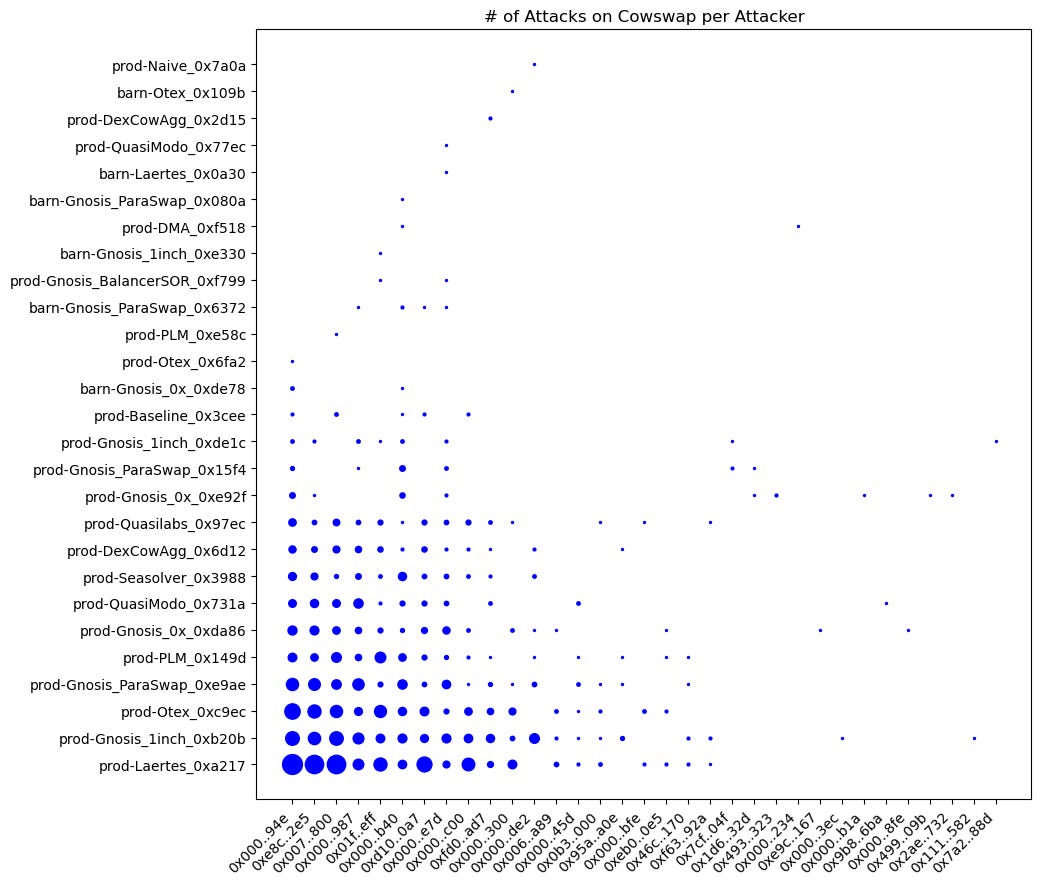
We have created a graph illustrating the relationship between the 33 attackers and 27 victims. Each point on the graph represents an attacker made on a solver, and the size indicates the number of attacks made by the attacker.
Upon closely examining the graph, it becomes evident that attackers did not concentrate their attacks on a single solver. However, it is worth noting that the top victim, prod-Laertes, was attacked by the top attacker 102 times. It suggests that solvers may need to adjust their algorithms or strategies to prevent attacks from specific attackers.
7.4 Top Solvers Under Attack by Sandwich MEV
Here is a list of the top 10 solvers that sandwich attacks targeted the most. They are ranked based on the number of attacks they have experienced (left) and the total volume attacked (right). Although they attacked prod-Laertes the most, the total volume attacked only ranks 7th. The solver with the highest volume attacked is prod-Gnosis, with a total attacked volume of $30M.
Ranking solvers solely by the number of attacks they suffered may not accurately reflect their vulnerability to sandwich attacks. To provide a more comprehensive picture, we have ranked solvers by the number of batched orders and the number of attacks. The chart shows that 0xc9 has been attacked more frequently, which may be due to its higher total number of batched orders. It is essential to consider both factors when assessing the vulnerability of CoW Swap solvers to sandwich attacks.
7.5 Investigations on Whether There Are Solvers That Avoid MEV
Here is a list of solver addresses that have not experienced any MEV attacks. It includes their batches, trades, and first and last batch dates.
7.6 Detailed List of the Value Extracted From Each Solver
8. Detailed Investigations on the Exploited Protocol by Attacking CoW Swap Trades
When CoW Swap cannot match orders peer to peer directly, it finds liquidity pools to match orders at the best price. Therefore, identifying pools or protocols most likely to be exploited for order matching would be valuable to CoW Swap solvers.
8.1 Exploited Protocols by Attacking CoW Swap Trades
There have been eight protocols that attackers have targeted. Uniswap v2 and v3 have been the most frequently attacked protocols, as they have a higher total trade volume from CoW Swap than other protocols.
8.2 Exploited Liquidity Pools by Attacking CoW Swap Trades
We ranked the top exploited liquidity pools and found that only Uniswap and Sushiswap pools were under attack. The results are ranked based on the number of times attacks took place. Notably, the Uniswap v3 USDC/WETH pool had the victim with the highest volume among all the attacked pools.
8.3 Investigation of the Protocols That Sandwich Attackers Least Exploited (By the Percentage of Trades)
On the chart, the colored protocols represent those that CoW Swap has used without being attacked. Among the attacked protocols, Balancer v1 has been the least exploited.
Conclusion
From the above analysis, the impact of sandwich MEV on transactions through the CoW Swap router is smaller from a broader perspective.
Revenue: The total revenue extracted from attacking Cow Swap solvers is $0.13 million. Compared to CoW Swap's total fee revenue of $8.55 million, sandwich attacks only constituted around 1.5%. However, after The Merge, the revenue drained from CoW Swap became more significant. The revenue drained after The Merge accounted for 13% of the platform's fee revenue, a considerable loss for solvers to consider. Nevertheless, through CoW Swap, the percentage of attacks is one magnitude lower than the total sandwich attacks percentage of trade directly in Uniswap or Curve.
Sandwich Frequency: The rate of sandwich attacks on CoW Swap in 2022 was relatively low, at around 0.8% of the total trades. However, the daily frequency of such attacks increased significantly after The Merge. The attackers mostly appeared before 'The Merge' but increased their attack frequency on CoW Swap solvers after the Merge. One potential reason is the transition from Proof of Work (PoW) to Proof of Stake (PoS) in Ethereum, which creates an environment where MEV becomes a significant source of incentives for block builders.
Sandwich Impact on different aggregators: The sandwich attack directly impacted around 2.7% of the total trades through the 1inch aggregator, with a percentage of attacked volume at 3.2%. On the other hand, Matcha experienced attacks on approximately 1.9% of total trades, with the percentage of attacked volume at 6%. Only 0.7% of trades and volume were attacked through CowSwap, making it the least exploited among the three aggregators.
Profit and Cost of Sandwich Attackers: Most of the revenue from sandwich attacks goes to block builders and validators, resulting in less profit for sandwich bots, and they generate a relatively small financial gain.
Sandwich Volume: Only $0.12 billion in volume was affected by sandwich attacks, which accounts for approximately 0.79% of Cow Swap’s total batched volume. Orders attacked on CoW Swap mostly range between $1K and $10K. In addition, compared to other DEXs, as shown in our MEV Annual Report, the volume of CoW Swap batched value attacked was only 0.78% of the total volume, also one magnitude lower than other DEXs.
Details on Solvers: After 'The Merge,' the daily number of solvers attacked increased. We identified 27 solvers under attack in 2022 based on our data. Some victims were not under attack as frequently before The Merge but received more exploits after the Merge. We have ranked our research results based on the number of attacks they have experienced and the total volume attacked.
Details on Exploited Protocols: There have been a total of 8 protocols that attackers have targeted. Uniswap v2 and v3 have been the most frequently attacked protocols, as they have a higher total trade volume from CoW Swap than other protocols.
Disclaimer
The "Information" contained in this post has been prepared solely for informational purposes, is in summary form, and does not purport to be complete. The Information is not, and is not intended to be, an offer to sell, or a solicitation of an offer to purchase, any securities. The Information does not provide and should not be treated as giving investment advice. The Information does not take into account specific investment objectives, financial situation or the particular needs of any prospective investor. No representation or warranty is made, expressed or implied, with respect to the fairness, correctness, accuracy, reasonableness or completeness of the Information.
We do not undertake to update the Information. It should not be regarded by prospective investors as a substitute for the exercise of their own judgment or research. Prospective investors should consult with their own legal, regulatory, tax, business, investment, financial and accounting advisers to the extent that they deem it necessary, and make any investment decisions based upon their own judgment and advice from such advisers as they deem necessary and not upon any view expressed herein.
*We are open to discussion. Please feel free to contact us via contact@eigenphi.com.


