Private Order Flows -The Sleeve Bidding of Crypto - Contribute 89%, $642.5M, of Builders' Income
In the quiet corners of rural Asian markets, an age-old tradition persists. Two traders stand close, hands hidden within long sleeves, fingers dancing in secret communication. This is "sleeve bidding," a centuries-old method of discreet price negotiation. While quaint, this practice holds a surprising parallel to one of the most powerful forces in today's cryptocurrency markets: private order flow.
Recent data has revealed a startling fact: Private Order Flow contributes to a staggering 90% of builder income, $642.5M since last Sept 1, in the crypto space. This isn't just a significant statistic; it's a revelation that reshapes our understanding of how the crypto market truly operates.
Much like those hidden hands in sleeve bidding, private order flow in crypto operates behind the scenes, invisible to the average trader yet wielding enormous influence. What does this mean for the crypto ecosystem? How has a practice that echoes an ancient trading technique come to dominate one of the most technologically advanced markets in the world?
Let's pull back the sleeve, so to speak, and examine how private order flow has become the hidden giant of crypto trading, driving the majority of builder income and shaping the market in ways that most participants never see.
How Much Value Went Through The Sleeve?
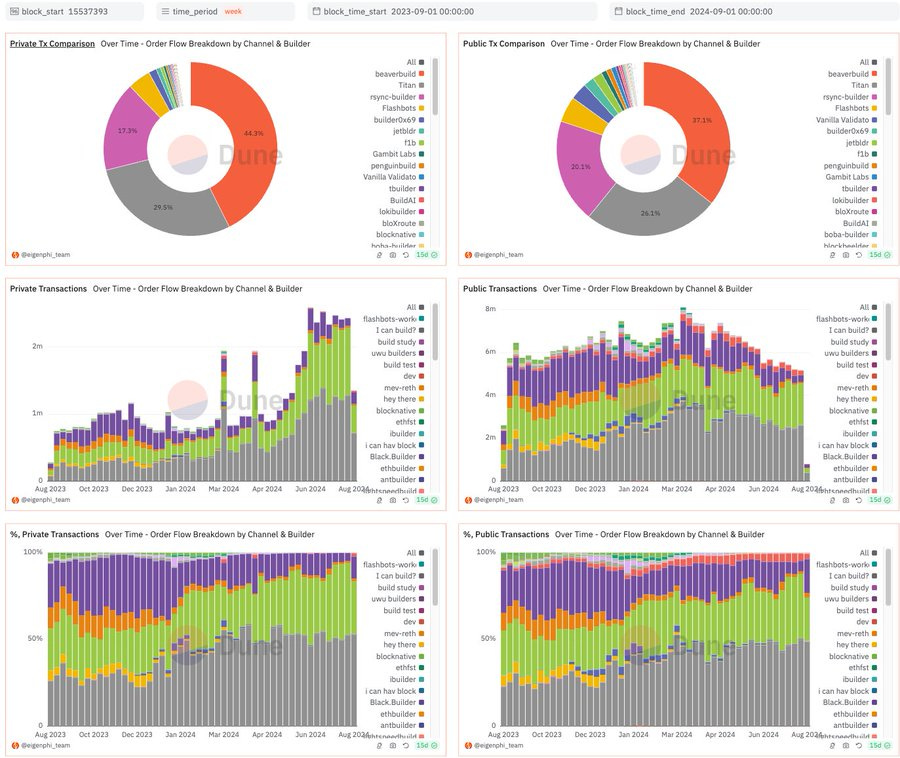
According to Blocknative, private transactions now account for about half of the total on Ethereum, in terms of the total gas usage. Our Builder Performance Analysis Dashboard on Dune sheds light on more details.
Since 2023.9.1, BeaverBuild has consistently dominated, handling 44.3% of all private transactions. The top 3 builders (BeaverBuild, Titan, and Rsync) collectively have processed over 90% of the transactions in private channels, with Titan 29.5% and Rsync: 17.7%. These numbers and the by-week time series are shown on the left side of the charts below.
The charts on the right show that BeaverBuild has 37.1% of all public transactions, while Titan has 26.1% and Rsync has 20.1%. In total, the top three have 83.3% of the public market.
Still, we need to answer questions like:
How much exactly do these order flows bring to builders?
What does it compare with public transactions?
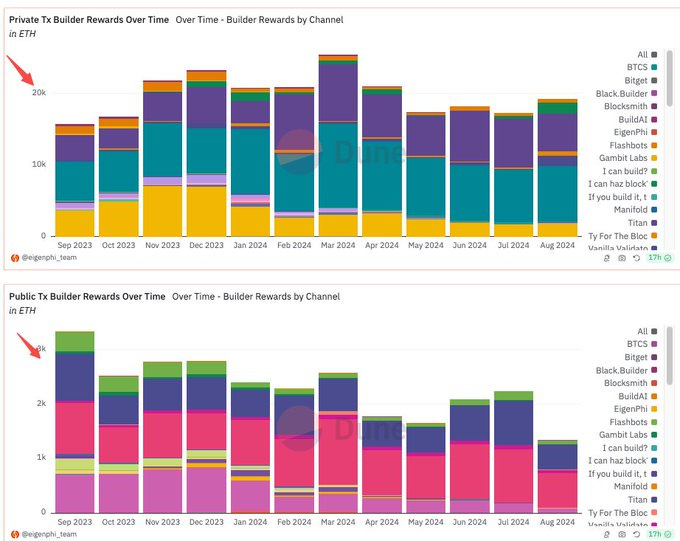
When you look at the Builder Rewards Over Time charts of Public v.s. Private, a general idea is that dark pools usually provide 8 to 10 times rewards of public ones.
We will present the exact amount after the analysis of the market shares.
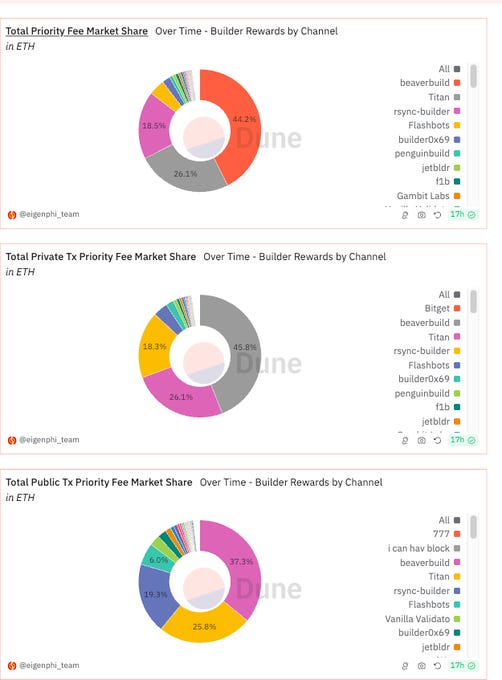
During the last 12 months, you can see the top 3 builders’ rewards market share and Public vs. Private. in these donut charts:
The exact market shares are:
Total: BeaverBuild - 39.1%; Titan - 27.2%; Rsync: 18.3%
Private: BeaverBuild - 39.3%; Titan - 27.3%; Rsync: 18.3%
Public: BeaverBuild - 36.6%; Titan - 26.2%; Rsync: 18.7%
Builder rewards are composed of 2 parts: priority fees and miner tips. We can split the above shares into more charts.
For the Priority Fee market, here we have:
Total: BeaverBuild - 44.2%; Titan - 26.1%; Rsync: 18.5%
Private: BeaverBuild - 45.8%; Titan - 26.1%; Rsync: 18.3%
Public: BeaverBuild - 37.3%; Titan - 25.8%; Rsync: 19.3%
Next is the Miner Tips market.
Total: BeaverBuild - 33.4%; Titan - 28.4%; Rsync: 18.2%
Private: BeaverBuild - 33.5%; Titan - 28.4%; Rsync: 18.3%
Public: BeaverBuild - 34.6%; Titan - 24.6%; Rsync: 19%
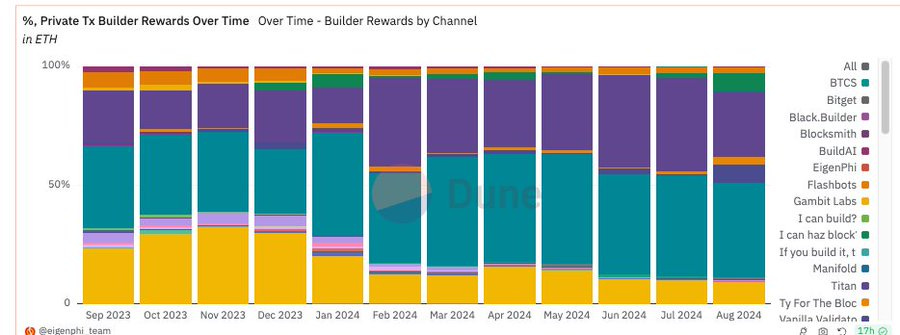
However, these percentages have changed over the last 12 months. Take private builder rewards, for example. Titan and Beaver have split Rsync's share as time passes.
Now let’s look at the amount these top 3 builders’ have earned.
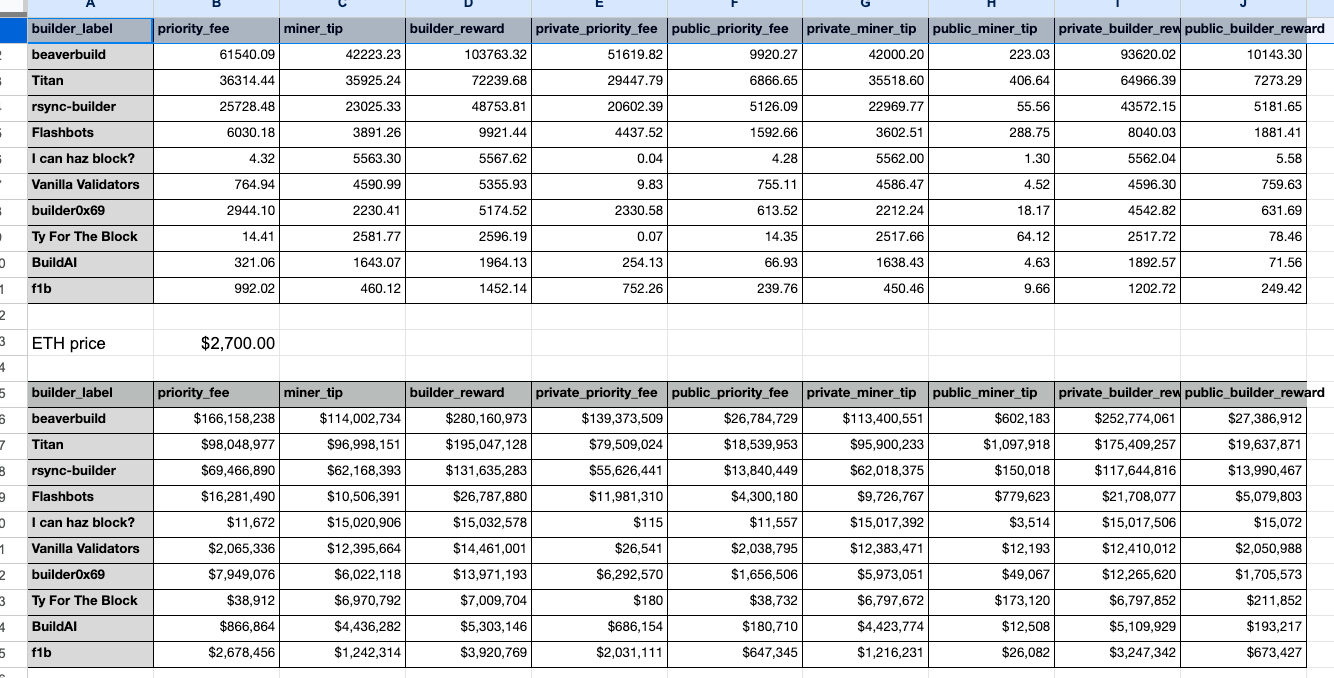
Our tables show that during the last 12 months:
BeaverBuild: Private-$252.8M; Public-$27.4M.
Titan: Private-$175.4M; Public-$20M.
Rsync: Private-$117.7M; Public-$14M.
We use $2,700 as the price of ETH.
Adding all together, Private Order Flows bring $642.5M income to all the builders, while $74.9M is generated from public mempools. In conclusion, 90% of all builders' income comes from private channels.
The next table shows the percentage distribution of the top 10 earners of builder rewards, proving the overwhelming position of private channels.
Top 10 Performers Appraisal
Next, we can examine the top 10 performers in 6 categories, separated by Public and Private. We use abbreviations, as shown in the tables below.
PF: Priority Fees
MF: Miner Tips
BR: builder Rewards
The number after the name is the amount corresponding to the category.
For the Private section. The 3 AVG categories are based on each builder’s included private transaction numbers.
Besides all the big guys we mentioned above, the 3 AVERAGE metrics show that "I can haz block?" and "Ty For The Block" dominate in BR and MT.
Meanwhile, "uwu builders," "i can hav block," and "nfactorial" shine when it comes to priority fees.
It's also worth noting that "bobTheBuilder,” “payload," and "antbuilder" stand out in the private sector as well.
Here are the numbers of Private Transactions and Builder Rewards they've received since 2023.9.1.
bobTheBuilder: 9,343, $2.8M;
payload: 7,526, $1.1M;
antbuilder: 4609, $332K.
Next is the public section, where traders put their orders in broad daylight.
We can see that:
Of all the total metrics, the only category BeaverBuild is not the best is Public Miner Tips, at which Titan and Flashbots outperform.
Titan is the only builder receiving more than $1M in Public Miner Tips.
“smithbot” and “Ty For The Block” excel in the Average Public Builder Rewards Per Transaction category. “smithbot” is good at getting Public Priority Fees while “Ty For The Block” thrives on Public Miner Tips.
Combining both Public and Private data, it demonstrates:
Jetbldr’s Middle-Tier Performance: Jetbldr earned $1.1M in Public BR and $1.8M in Private BR, maintaining a consistent, moderate performance.
Gambit Labs’ Niche Role: Gambit Labs shows a stable but niche role with $693.9K in Public BR and $1.6M in Private BR.
Antbuilder’s Consistency: Antbuilder ranks consistently in the average public PF ($0.83) and the average private PF ($14.72), indicating stable fee efficiency across both sectors.
Feel free to visit EigenPhi’s Builder Performance Analysis Dashboard on Dune to explore more data, including the above.
Hidden Flows, Visible Impact
The dominance of private order flows, contributing 90% of builder income, reveals a concerning trend toward centralization in the crypto market. This concentration of power in the hands of a few top builders contradicts the decentralized ethos of cryptocurrency. It creates potential for market manipulation, reduces transparency, and raises barriers for new entrants. The crypto community now faces a critical challenge: balancing the efficiency of private order flows with the need for a truly decentralized ecosystem. As we move forward, addressing this hidden centralization is crucial to ensure that cryptocurrency remains true to its original vision of open and democratic finance.
Next, we will examine how the $642.5M is distributed among proposers. Stay tuned.
Wanna find out which builder raked $3.5M on Black Monday?
The MEV Builder That Raked $3.5M on Black Monday
During Black Monday, the biggest winner among builders is beaverbuild, as shown in our last post. But you would not guess who ranked the 2nd regarding builder rewards. It’s neither Titan nor Rsync; instead, it is the builder labeled MEV Builder 0x3b, which took 1,448 ETH, worth $3.5M.
Visit our Head First of DeFi to decode the DNA of DeFi Transactions & Strategies to learn more about the DeFi Lego.
Follow us via these to dig more hidden wisdom of DeFi:
EigenTx | Website | Discord | Twitter | YouTube | Substack | Medium | Telegram


