Thriving Amidst Turmoil: the Key Takeaways for MEV Annual Performance in 2022
Revealing how the secret engine of DeFi - MEV - rised to the top.
Despite the multiple crises that have rocked the DeFi market over the past year, the MEV's performance has continued to demonstrate its resilience, adaptability, and long-term potential. From crypto giants’ collapse to the new auction market after The Merge, the market has shown that MEV is more than capable of weathering even the most challenging of environments.
Let’s dive into the highlights of the MEV annual report and get ready to view the growth and perseverance of MEV performance through the lenses of bots, builders, and trading volumes!
Rise to the Top: The Thrilling Journey of Best MEV Bots - Exploring Lifespan, Profitability, and the Blood-Battling Secrets in the Quest for Financial Success!
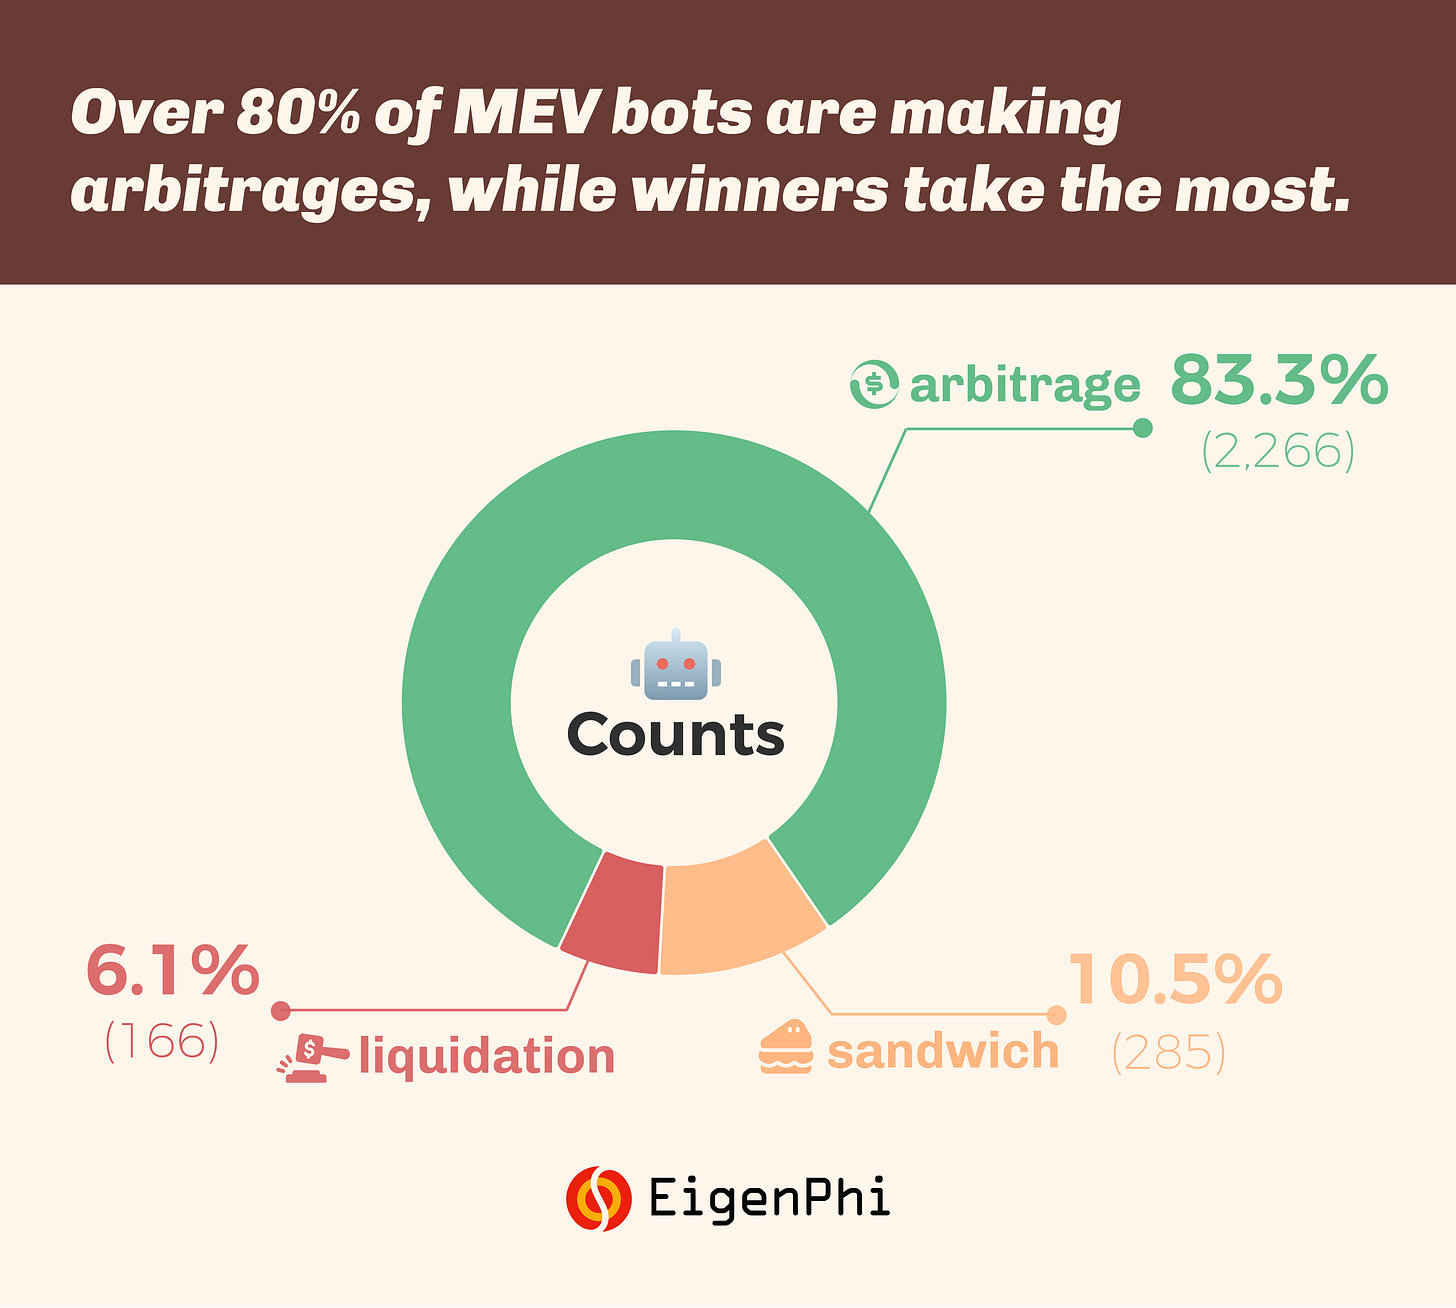
MEV is a fierce battlefield, with over 2.7K MEV 🤖s vying for profits. The arbitrage 🤖 are dominating the market, accounting for over 80% of total players.
In the cutthroat world of MEV, only the strongest may survive. See, the most profitable arbitrage 🤖 0xbad generates the highest profits of over $9.2M. One grabs 12.3% of the total profits from arbitrages! 🚀🚀


This arb 🤖 0xbad also created the most profitable single arbitrage transaction. It profited $3.197 million at the cost of $2,057 in one atomic transaction during the Nomad bridge exploit. Unfortunately, this bad guy is gone for good.
Liquidators may have a deeper understanding of the phrase "winners take the most." Looking at this profit leaderboard, the top alpha predator for liquidation has devoured 41.3% of total profits generated by liquidation 🤖!!


The top 10 arbitrage bots collectively hold about 51.3% of the market value, while the top 10 sandwich bots hold 74.8%, and the top liquidation bots notably hold 90.2%. You can also keep updated with the 🤖 profit leaderboard at https://eigenphi.io/.

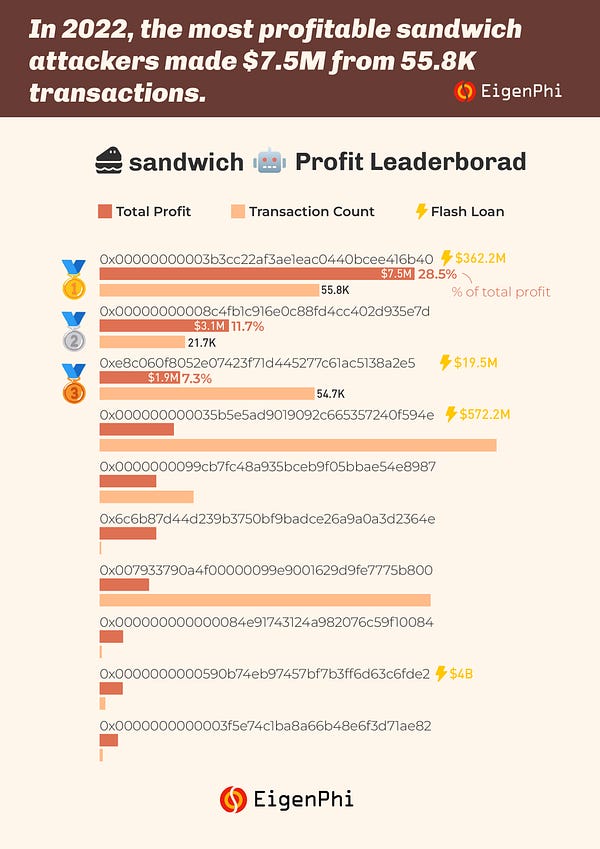
But others could not be so lucky. In 2022, over one-third of 🤖 reported negative profits, and nearly half of the liquidators suffered a loss. Only small amounts of 🤖 can make over $10K in profits.
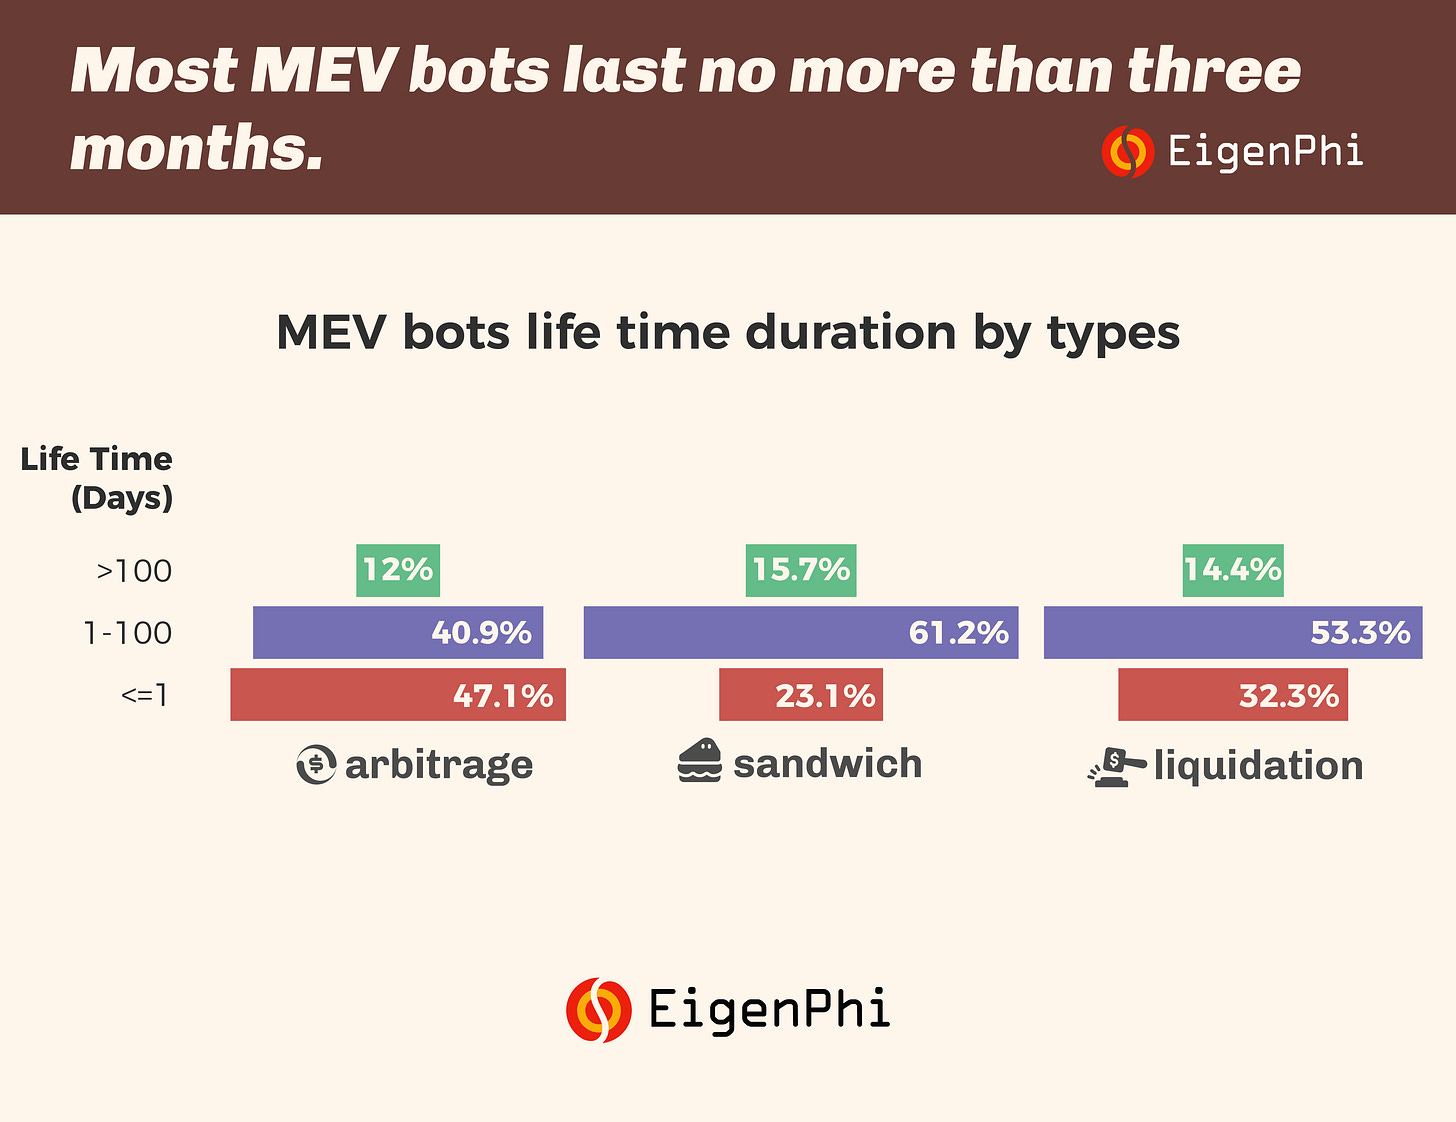
Most of the bots could not last more than 1 day, mainly for testing purposes. In general, arbitrage 🤖 have a shorter lifetime compared to sandwich and liquidation ones, while 47.1% have lived for less than one day.
Riding the Wave of MEV Opportunities: In 2022, Arbitrage Dominates the Market, Promising Explosive Growth for Savvy Searchers.
Our results show that arbitrage opportunities were the most frequent, accounting for 68.3% of the market. Sandwich opportunities are around 30.6%.
Opportunities for liquidation are far smaller than the other 2 MEVs, for it was more likely to depend on intense market fluctuation rather than conventional arbitrage ones. But the liquidation, the 1% of total MEVs, gained 11% of the total revenue.
Rising and rising, MEVs were getting more and more, regardless of the price of $ETH. Arbitrage bots traded more frequently than sandwich and liquidation bots in most months.
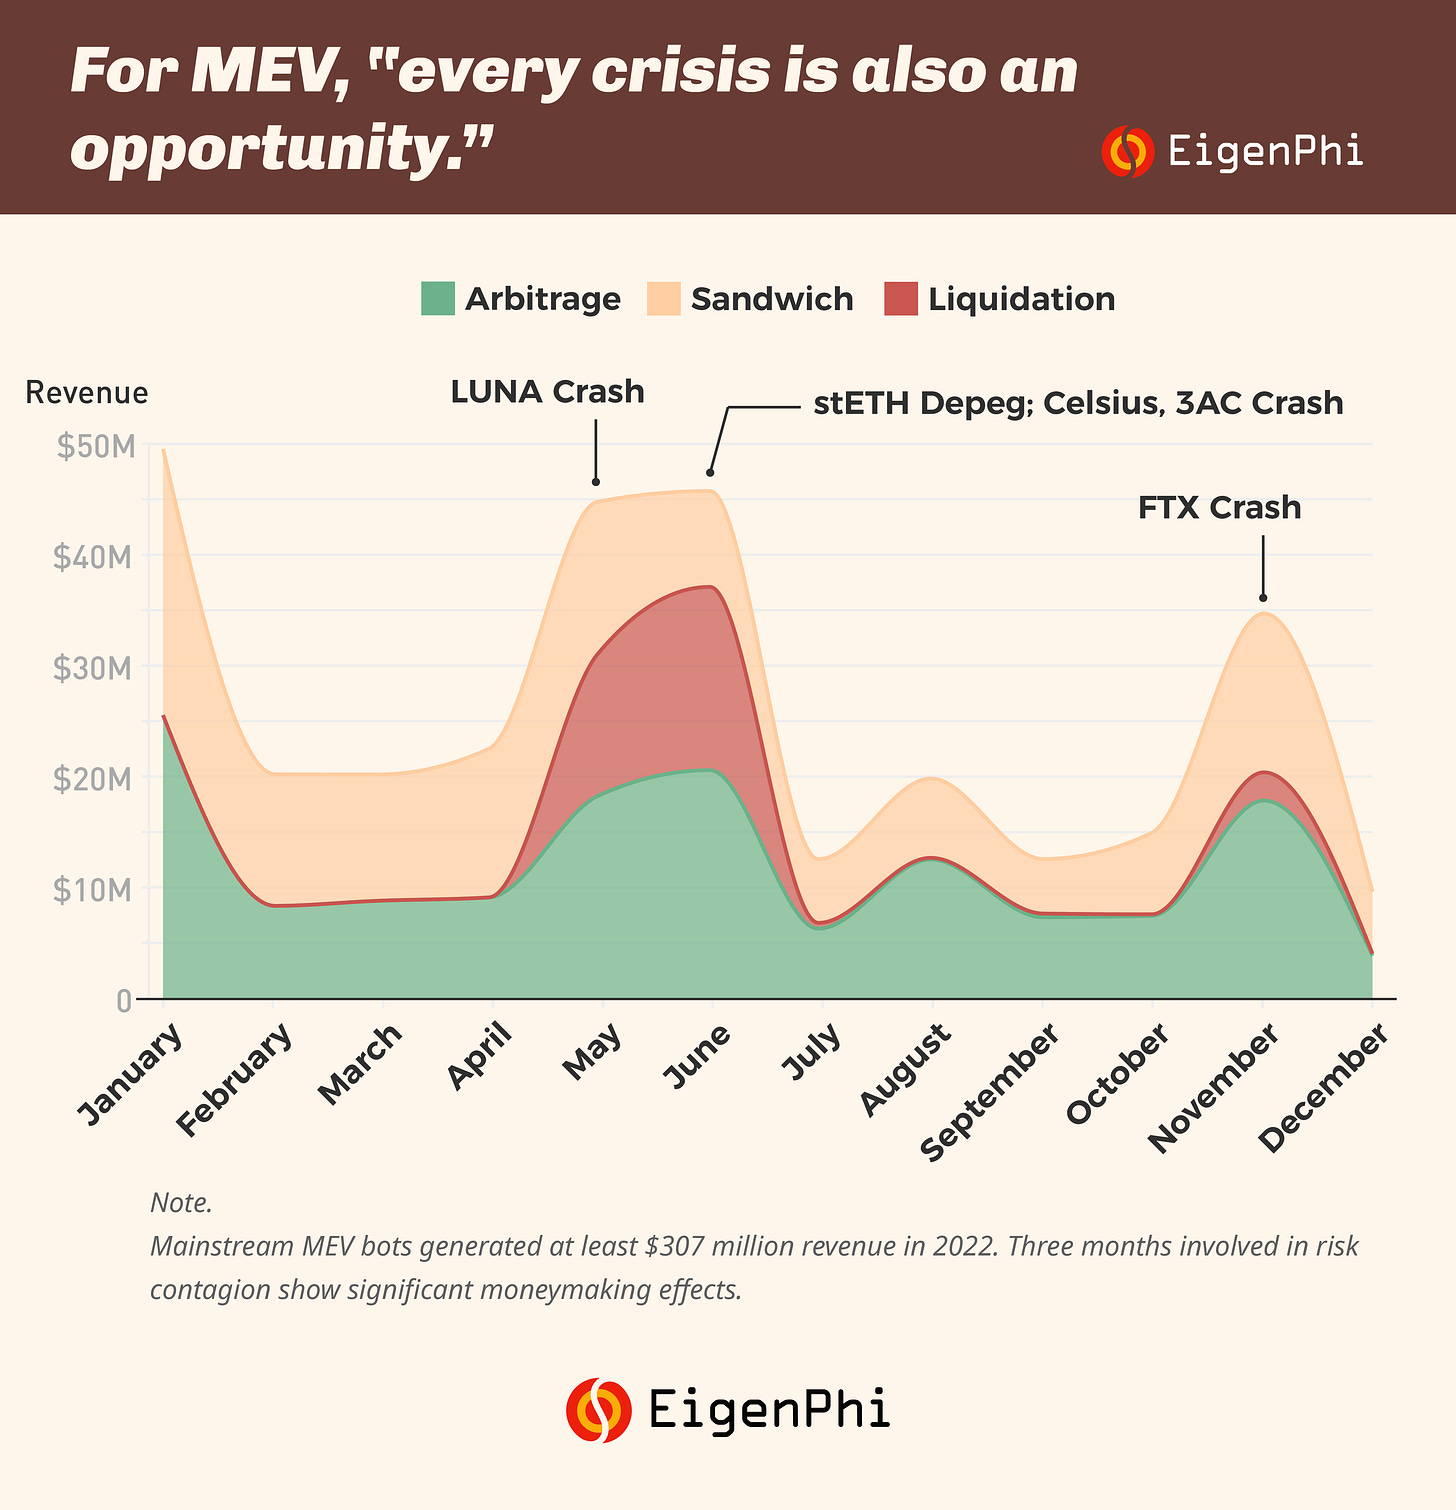
$LUNA crash, $stETH depeg, #FTX collapse; these crisis meant big time for MEVs. The chart below shows the monthly revenue change of MEV types.
👉 June was liquidation and arbitrage's best month.
👉 November belonged to 🥪 chefs.
Wonder about the impact of The Merge? Combining these 2 charts above, you can tell that the frequency of Sandwich front-running was definitely getting higher, not the revenue under usual conditions. It's no doubt that the Merge has increased the cost of making 🥪.
Based on our research, in 2022, sandwich transactions had a higher cost-revenue ratio each month when compared to arbitrage transactions, with an average of 0.78 for sandwich transactions and 0.49 for arbitrage transactions.
About November's liquidation revenue spike, it's because of the CRV short-squeeze event. For more detail, read our In-depth Analysis of How AAVE's $1.6 Million Bad Debt Was Created: https://eigenphi.io/report/aave-bad-debt
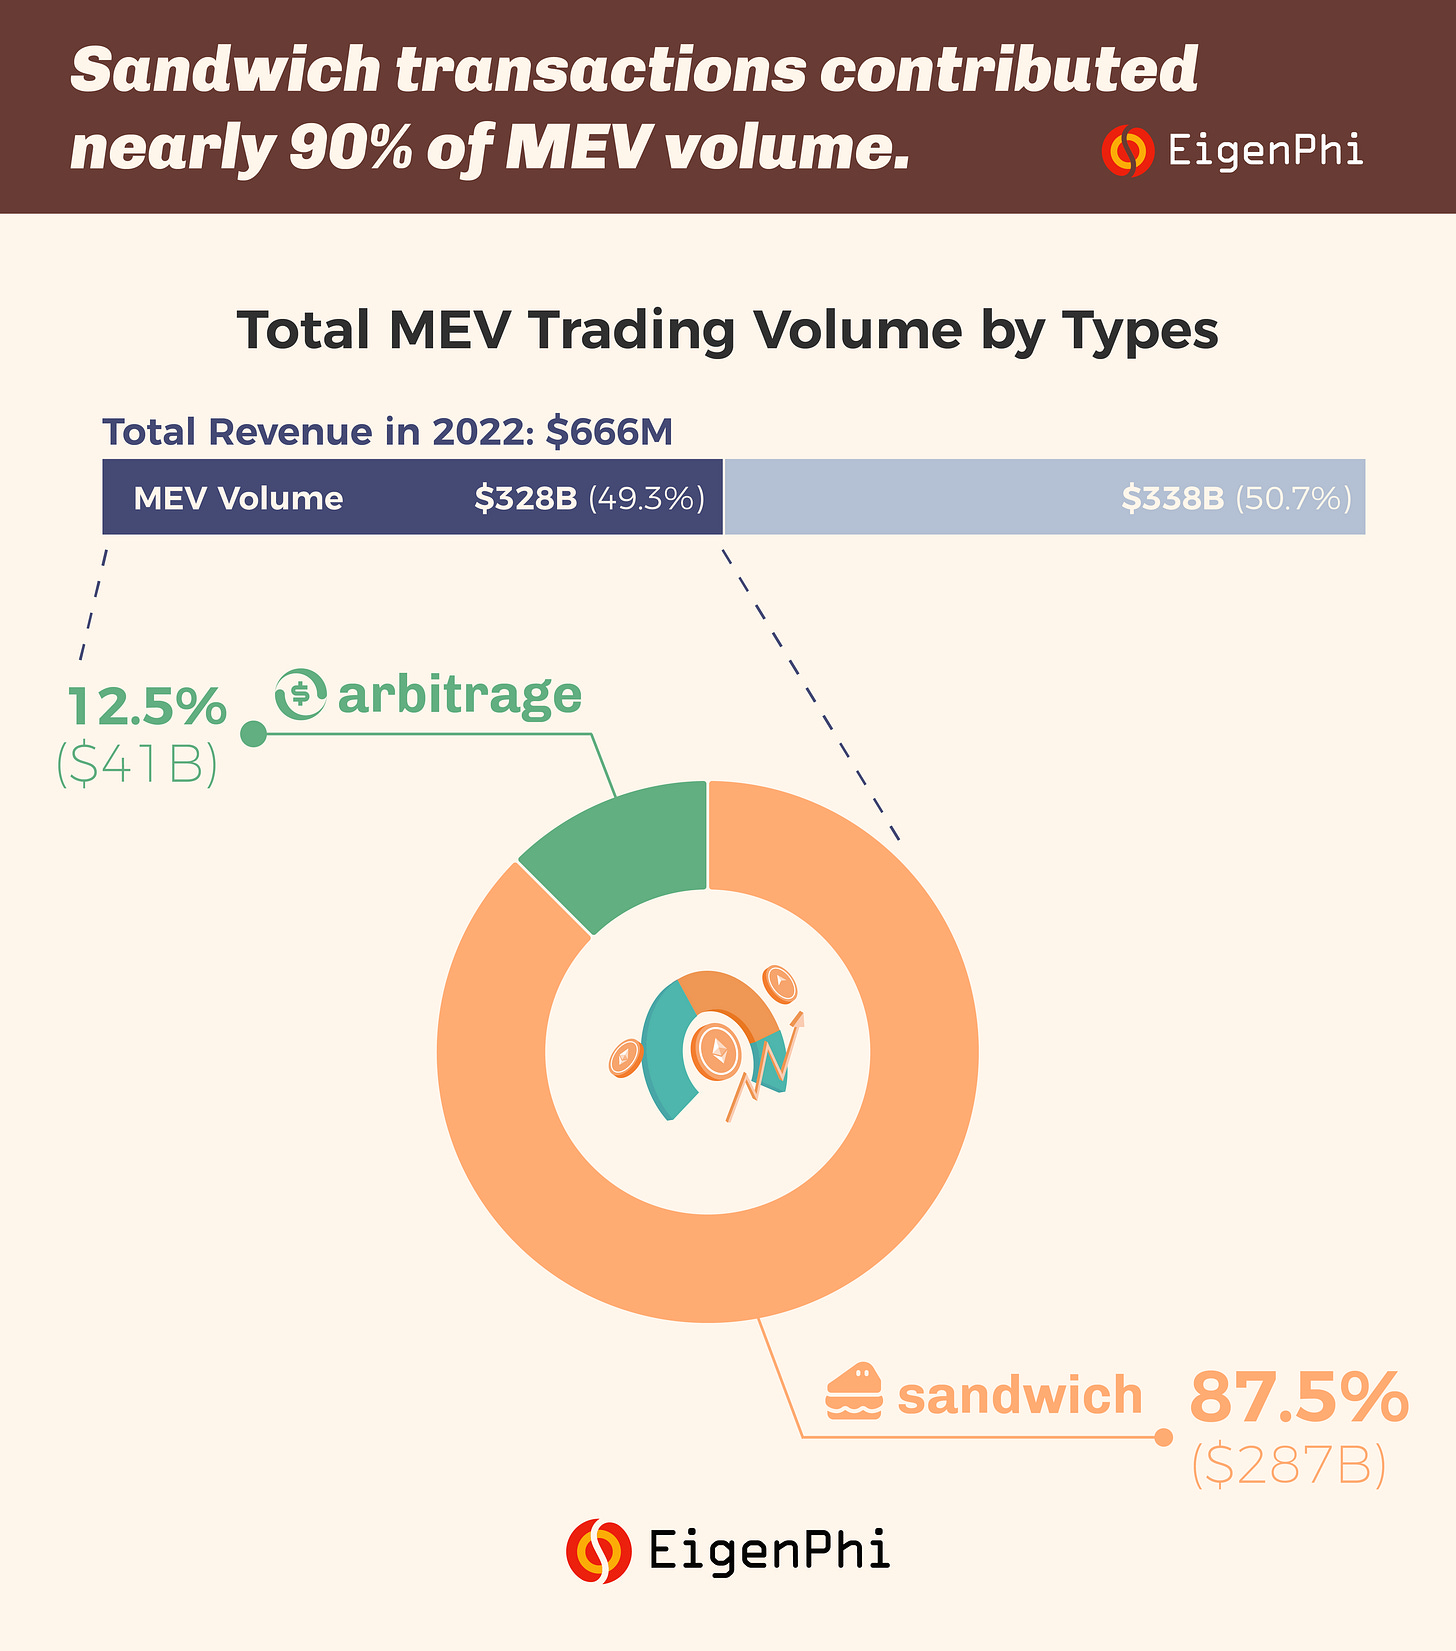
The Secret Engine of DeFi: MEV generated half of 2022's total volume of DEXs.
📈 DEXs volume: $666 billion (source: DefiLlama).
🤑 MEV volume: $328 billion.
In this section, we will dissect how MEV trading volume was distributed in the past year.
In 2022, among the $328 billion, 🥪 had 87.5%, $287B volume. While the arbitrage 🤖 contributed $41B, 12.5% of the total.
Wonder why 🥪's trading volume was so high? The key was the consuming nature of 🥪. The attacker must invest a larger volume to initiate price slippage to generate the profit, as shown by our investigation into the sandwich impact on Curve.
Examining the distribution by time, we can see a particularly significant increase in November. This surge in 🥪 volume can be attributed to the FTX crash, which led to an influx of users flowing into decentralized exchanges to exchange their assets.
In other words, large swaps within AMMs during a crisis can present significant opportunities for both arbitrage and 🥪 attacks, resulting in a larger volume of sandwich MEV. 👇 See other MEV opportunities that happened in 2022:


Let's see the volume of protocols. Uniswap V3 is the leader for both arbitrage and 🥪 volume, owing to its dominance in the DEX market. The 🥪 volume in DODO and Uniswap V3 represented nearly half of their total volume, making it a notable point for users to consider.


Also, it is worth noting that we optimized our calculation of the trading volume of 🥪 in protocols. Previously, our data included the volume that attackers brought to each protocol when trying to attack other protocols, which indicates the opportunities that 🥪 brings to protocols.
Now, the newly updated data presents the volume of each protocol being attacked, providing a more precise indicator for protocols to estimate the impact of sandwich attacks directly bring to them.
Wait! Interested in more of the overall MEV performance in 2022 and wanna detailed data? Visit the full report for more insightful advice:
You can also download all the highlights in one pdf: https://bit.ly/3Y2w0ER
Follow us via these to dig more hidden wisdom of DeFi:


