

Highlights of Our Award Report: MEV's Impact on Uniswap
Highlights of Our Award Report: MEV's Impact on Uniswap
Thorough the hunting season that MEV brought to the DeFi world, the dark forest full of attractive wealth opportunities.

Our analysis report just won the FIRST PLACE in the @uniswapgrants Community Analytics (UGPCA)'s Bounty #19. See the FULL REPORT via EigenPhi.
MEV (Maximal Extractable Value) has already become a central topic in 2022, not very long since the original notion was proposed. MEV is also regarded as permissionless incentives in blockchains, extractable on a first-come basis. However, the attractive wealth opportunities in the dark forest are also hard-to-discover and require specialized capabilities. These facts raise concerns about public issues within Ethereum's ecosystem, from the block congestion problem caused by Priority Gas Auction (PGA) to more critical security issues due to possible vulnerabilities among the validators and block builders.
In this report, we present an in-depth data analysis of the typical MEV bots' activities involving Uniswap V3 and share some insights on how MEV data is becoming more important to better understand the long-term impact of MEV on AMMs.
Let's take a look at the highlights of this article:
To figure out how MEV has impacted users on Uniswap, this report aims to answer the following two questions:
To what extent is the impact on the Uniswap community and its users?
Which Uniswap users and liquidity pools are more likely to be involved?
Revenue of Bots' Activities
Do you know how much the MEV has made from Uniswap V3 since Jan 2022?

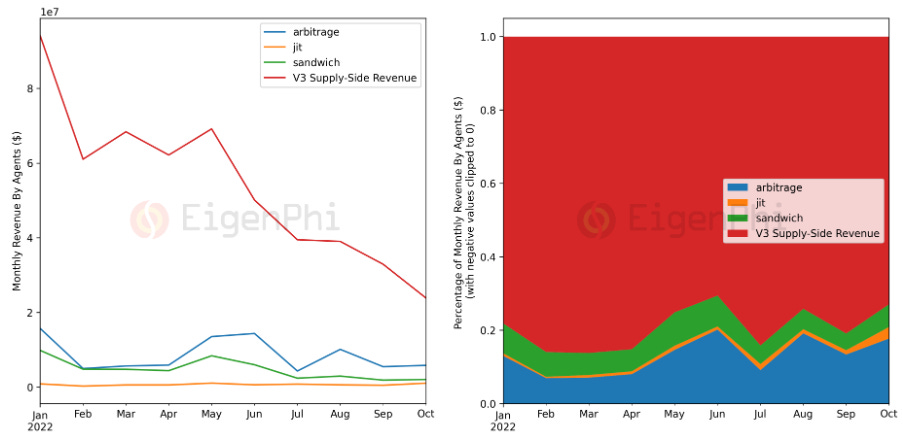
Arbitrage bots have extracted at least $85 M from market price asymmetry involving Uniswap V3 pools.
Sandwich bots have extracted at least $47 M from Uniswap V3 pools' swap users.
JIT bots have extracted $6 M from Uniswap V3's swap fee revenue.
The total extracted value of these three types has crossed 25% of the supply-side revenue ( i.e., LP's revenue from swap fee), $540 M.
And arbitrage bots turned out to extract more values than other types (sandwich and JIT).
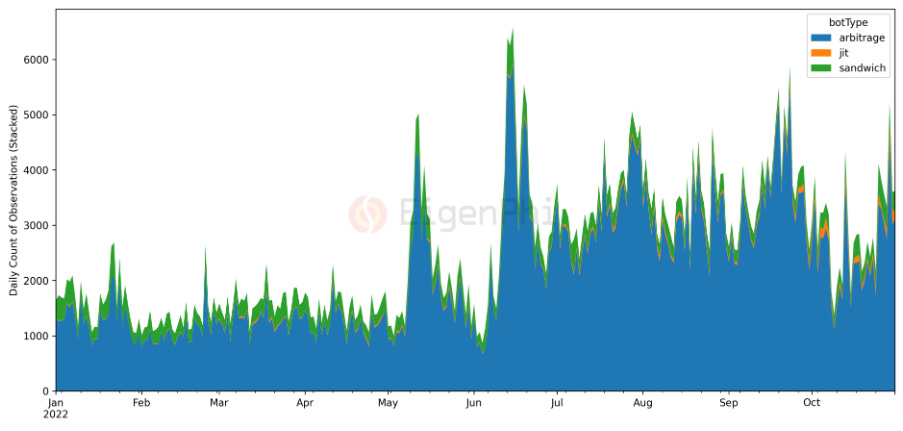
Frequency Analysis
Which MEV bot is most likely to find opportunities? Arbitrage, sandwich or JIT? Apparently, arbitrage bots rule.
Profit of Observations
From the daily profit distribution, we can see that arbitrage and sandwich bots gain an average profit on most days and have a few lucky days to make a lot of money. For example, on August 1st, the arbitrage bots' daily profit reached over $4.47 M. On that day, a simple spatial arbitrage contributed 71.6% ($3.20 M). From the daily profit percentage of JIT bots, they seem to make more money than arbitrage bots sometimes
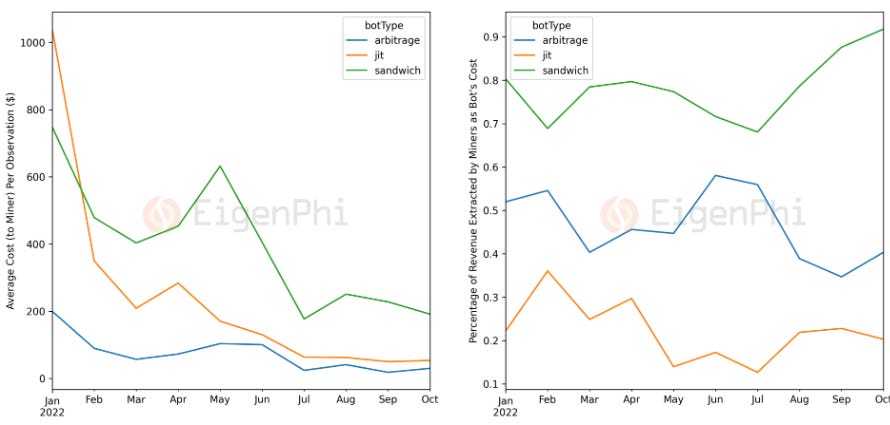
Cost of Observations and Miner Extracted Value
Everything comes with a price. Something just costs more than others.
The average cost of (gas fees and tips to miners) shows a downward trend. But the cost of sandwich is higher than the other two kinds, and the revenue proportion for miners has grown significantly (90% in Oct). The percentage of miner extracted value from JIT is the lowest, which is consistent with the less competitive situation. In total, 50+% of the extracted value actually flows into the miners' pockets.
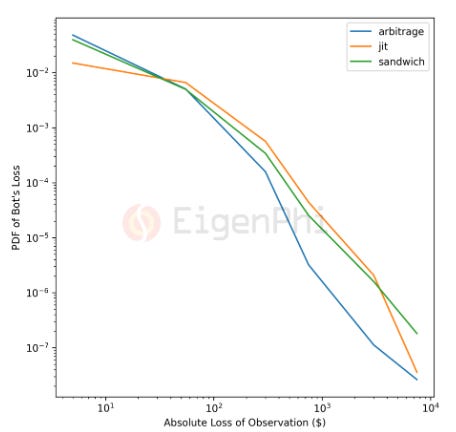
Btw, MEV bots are not always making money. From the perspective of the on-chain transactions, MEV bots will also suffer considerable losses in a single action.
Impact on Pools
Which Uniswap pool does swap users suffer from sandwich activity the most? 80+% of sandwich's profit comes from the top 10 pools (sorted by trading volume). But only 20% of sandwich activities occur in these pools.
Regarding JIT bots, they seem to be more focused on the top 10 pools sorted by trading volume. While 84% of profit was extracted from these pools, 56% of JIT activities also happened here.
Pools with a fee tier that equals 0.0005 or 0.0001 are more likely to be extracted in terms of arbitrage bots' average activity frequency. Pools with fee tier 0.0005 suffer mostly from sandwich activities. JIT activities also happen mostly in pools with a fee tier 0.0005.

Bot Leaderboard (Top 20)
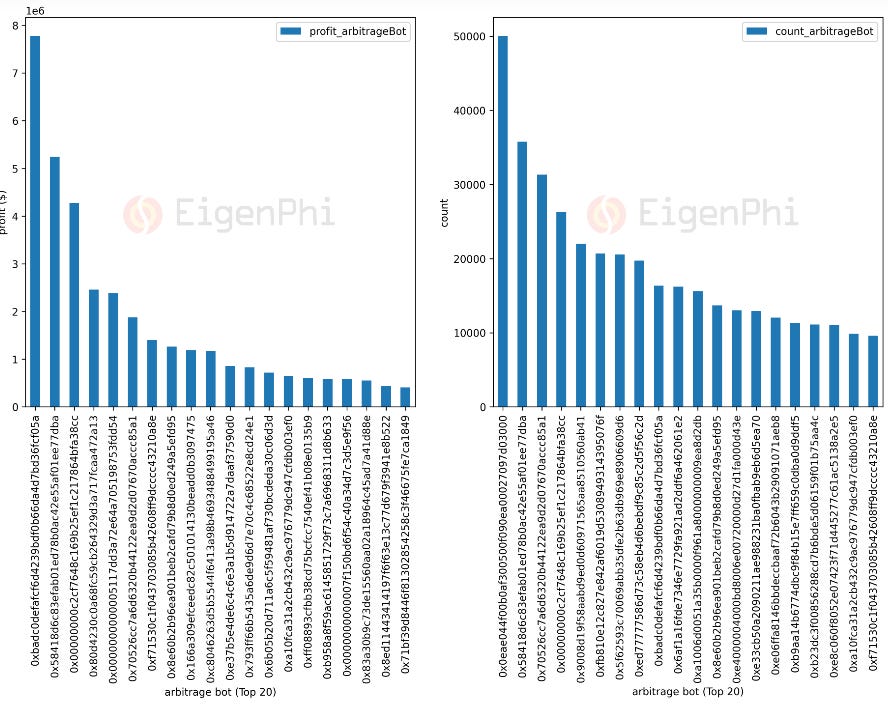
The following plots show the top 20 arbitrage contract addresses sorted by total profit and total activity count, respectively. The relationship between total profit and total activity count shows a positive relationship with a ceiling value of profit a bot can maximally extract.
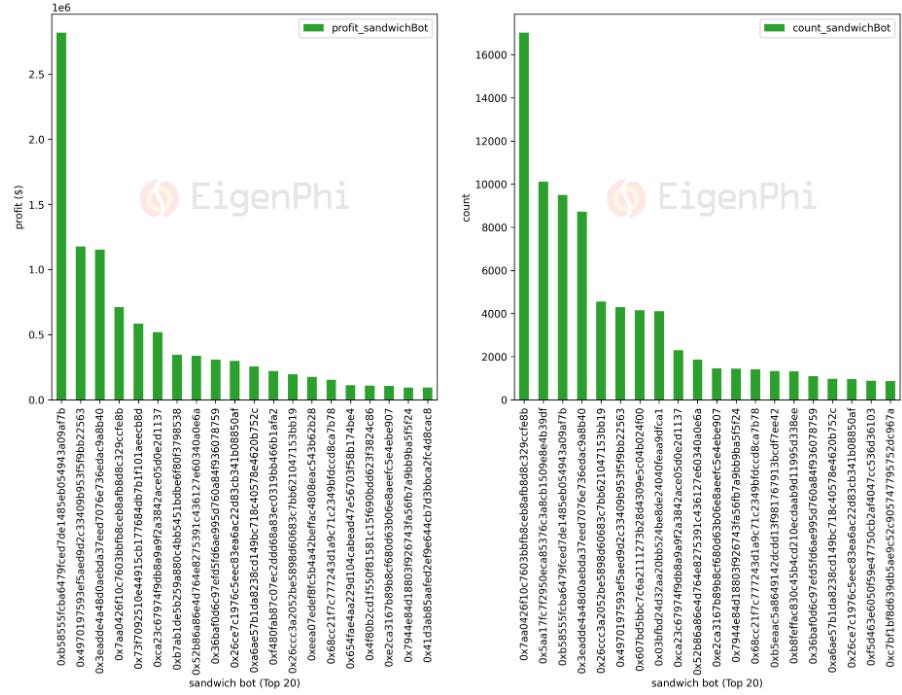
The following panels show the top 20 sandwich contracts' addresses sorted by total profit or total activity frequency respectively. The relationship between total profit and total activity count shows that most profitable bots are more capable of successfully submitting transactions more than 100 times this year.
In most cases, there is only one swap user sandwiched in a single sandwich activity. But sometimes, the sandwich bots can front-run up to 4 swap users' swap transactions in one shot within our observation scope. The most suffering swap user was involved in over 300 sandwich transactions this year.
.
Swap Users Benefit from JIT
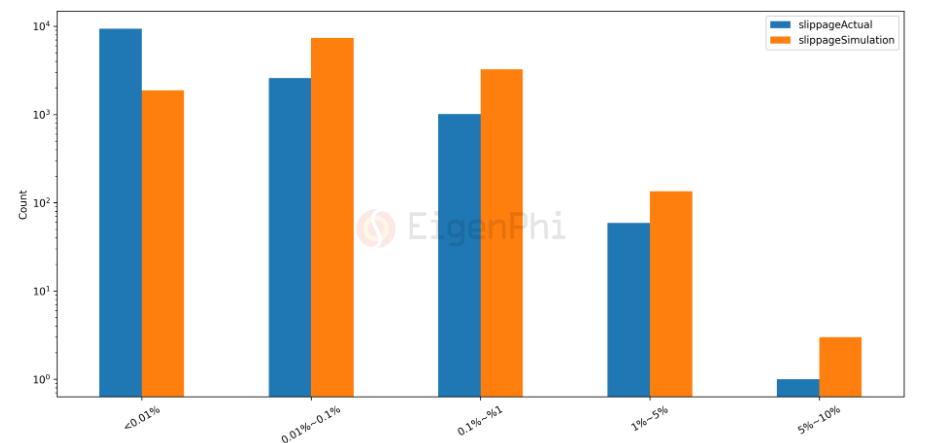
JIT bots can provide a large amount of liquidity to targeted swap users, making it an advantage for them to have smaller slippage loss. From the top 20 beneficiary data below, many swap users are enjoying this new feature frequently. We calibrate the benefit by simulating possible slippage the swap user may bear without JIT bots' activity in each observation. From the histogram of both simulated slippage and actual slippage as presented below, a clear shift from larger slippage rates to smaller ones can be seen. During the calculation, we also find that there are negative slippage values in a few cases. By checking the reason manually, we find that in some JIT bots' transactions that add liquidity, they will perform reverse swap transactions for some reason, which brings a more favorable price to the next swap user.
From the above analysis, we can see that robots have become an integral part of the AMM community that cannot be ignored. Understanding the transaction relationship between MEV bots and other entities can help stakeholders better understand the long-term impact of MEV on AMM.