Guess Which Builder Took $8.2M From the Table During Black Monday?
Bad time for degen; prime time for builders.
August 5th, the BLACK MONDAY of crypto. Degens were trying to escape the crash by sending their orders via all channels possible left and right, with high priority fees. Searchers and liquidators were reaping huge revenues during this rare scenario far and wide using arbitrages and liquidations with high builder tips for block builders.
Among all the builders, who reigned supreme?
Besides these spectacular times, we also need answers to questions like:
What's the real deal with builders' private order flow shares?
Who’s cashing in the most from private order flows?
Can smaller builders break BeaverBuild and Titan's market stranglehold?
Our latest Builder Performance Analysis Dashboard on Dune reveals the top contender, this ferocious beast, pocketing a fierce 3.4K ETH, worth $8.2M, in builder rewards.
Eager as a Beaver: Dam-Good Performance Floods the Market
From Aug 3rd to 5th, @beaverbuild raked in 3.9K ETH, a whopping 47% of its July haul in just three days. The beast's income is more than that of @rsyncbuilder and @titanbuilderxyz, adding as 2.6K ETH.
@beaverbuild's market share in public transactions and private order flow has been monopolized in the last three days.
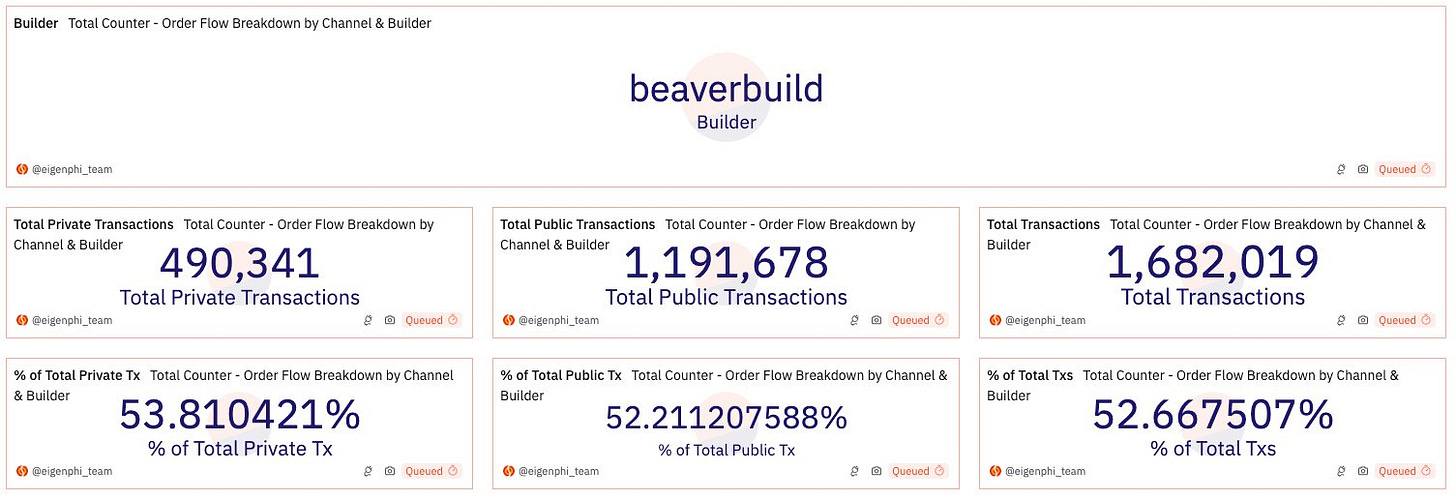
Public: 52.2%, 490K in transaction number.
Private: 53.8%, 1.2M in transaction number.
Overall, it was 52.7%, or 1.68M in transaction number.
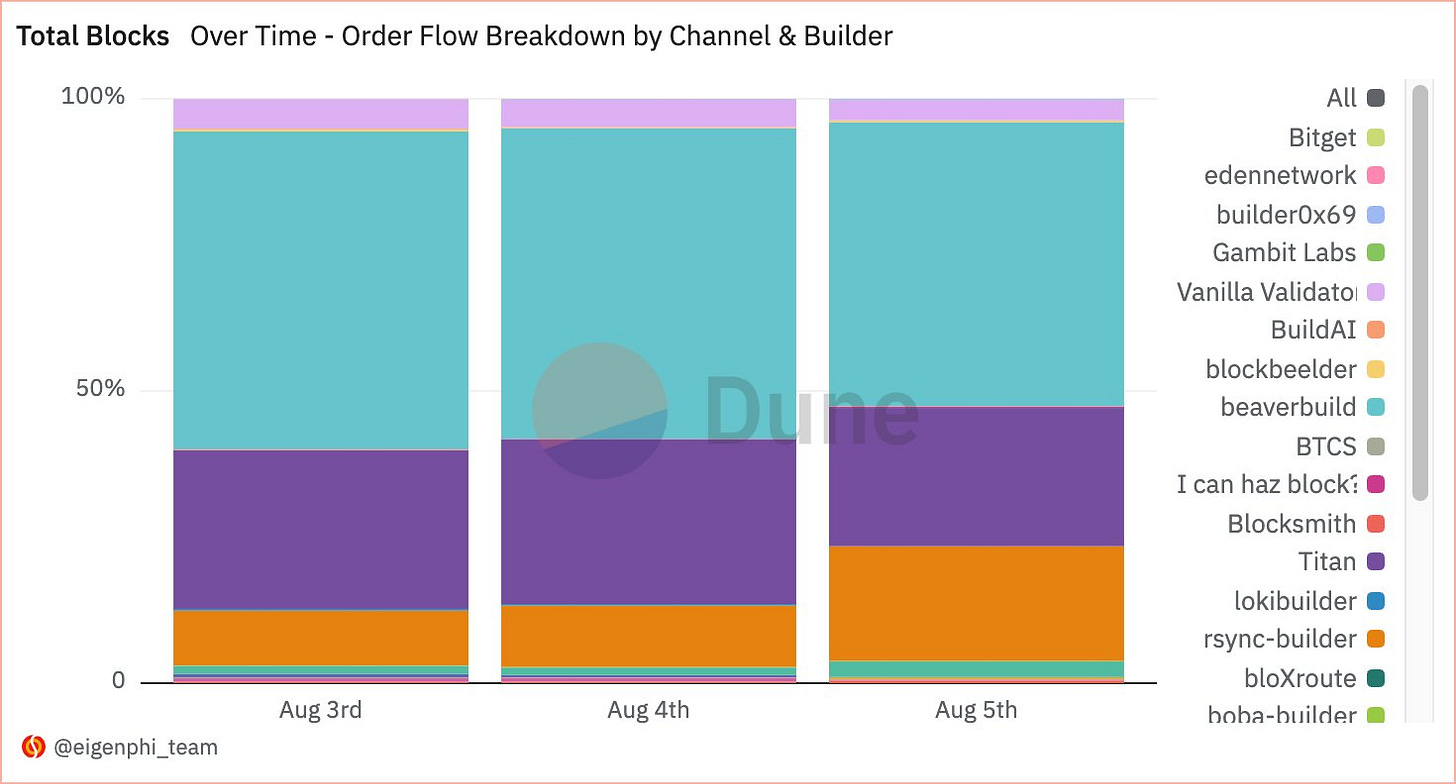
Packing these transactions into blocks, the beast took 52.7% of all.
Among all the 3.9K ETH won by beaverbuild, 2.8K came from miner tips, and 1.1K was given as priority fees.
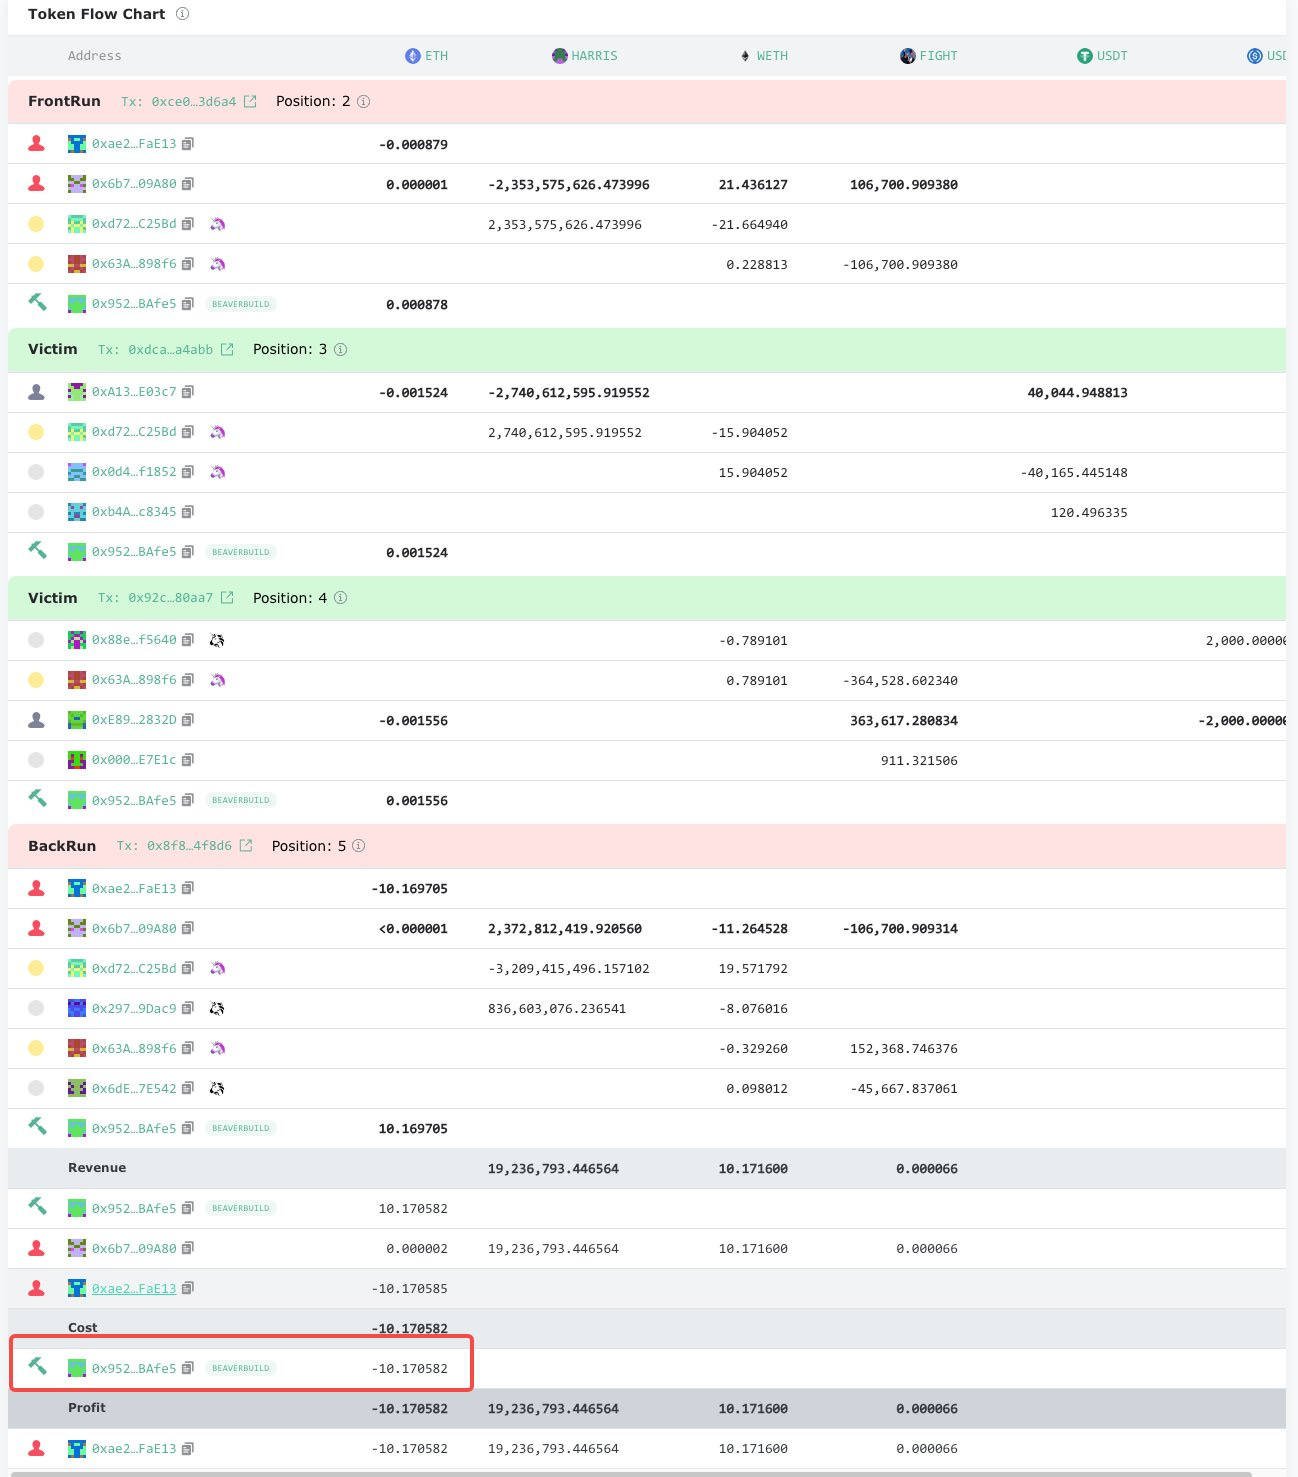
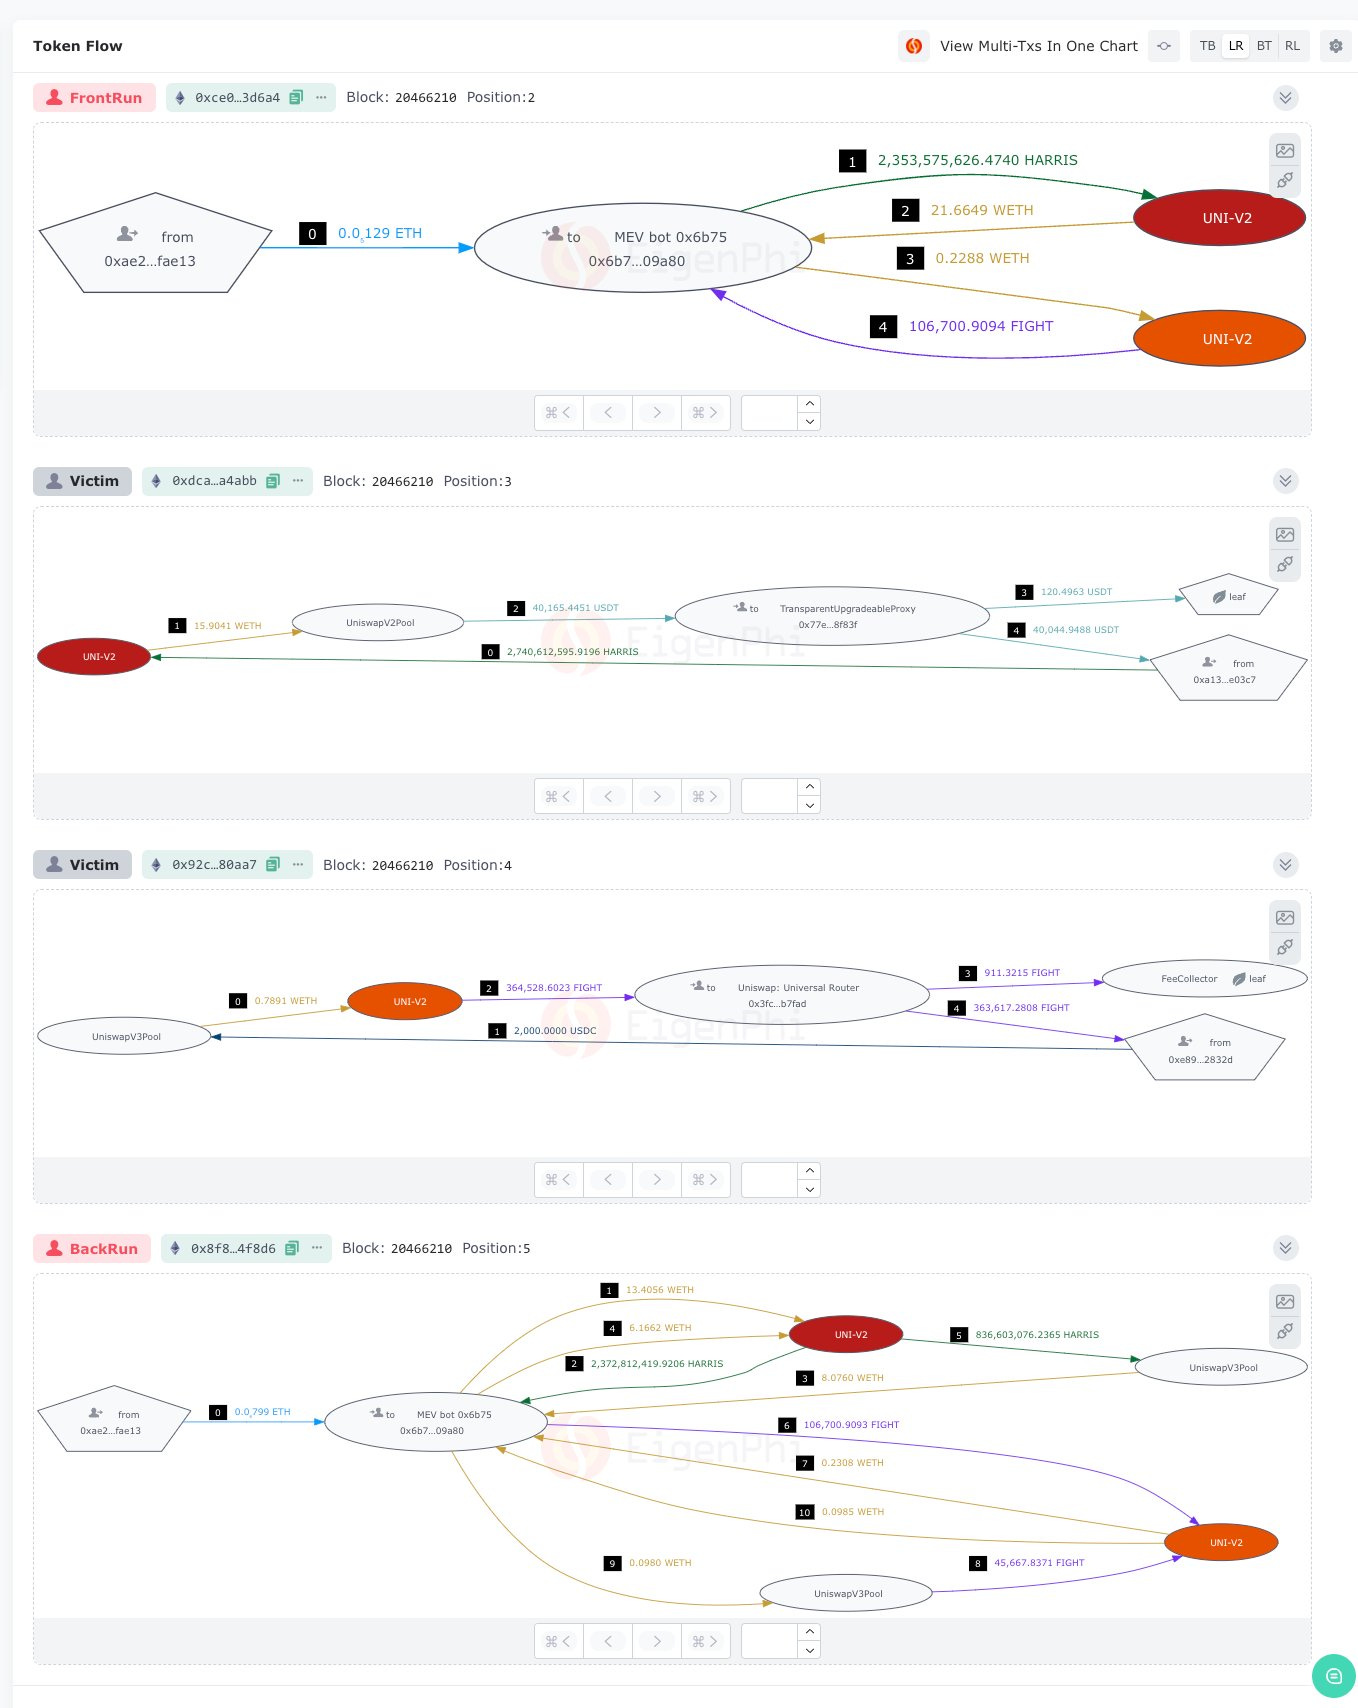
The biggest EOA paying priority fees belongs to Jaredfromsubway.eth, who paid 432 ETH to get @beaverbuild to pack all the sandwiches.
For example, Jared was willing to share 10 ETH, $25.8K, with beaverbuild to get this sandwich attack on-chain, while Jared only took $473.
Who transferred the most miner tips? It's SCP, the HFT firm on the same bank as beaverbuild. The contract sent 1.14K ETH to the beaver from the 3rd to the 5th.
You can find all this builder performance data in our cutting-edge Builder Performance Analysis Dashboard, answering questions in the beginning.
The Place for All Your Builder Income Inquiries
All the charts in the dashboard cover data since 2023.9.1. till now.
The dashboard comprises two sections: general market status and single builder performance.
The Concerning Macro View
The picture below gives you a holistic view of the current builder market regarding Private Transactions vs. Public ones before Black Monday.
Let’s look at the overall percentages.
Here are 3 key findings.
BeaverBuild’s Consistent Dominance:
Private Transactions: BeaverBuild dominates with 43.9% of private transactions.
Public Transactions: BeaverBuild also leads in public transactions with 36.9%.
Market Share Distribution:
Private Transactions: The top three builders (BeaverBuild, Titan, and Rsync) collectively handle over 90% of private transactions.
Titan: 29.2%; Rsync: 17.7%
Public Transactions: These three builders also have significant shares but with slightly different proportions.
Rsync: 25.9%; Titan: 20.3%
Titan obviously takes a better position on private Order Flow than Rsync.
Role of Other Builders:
Private Transactions: Other builders, including Flashbots and builder0x69, have much smaller shares, indicating a high concentration at the top.
Public Transactions: The distribution is more varied among other builders, suggesting more competition and diversity in the public transaction market compared to the private transaction market.
The charts below illustrate the private transaction market in time series.
There's a clear upward trend in the total volume of private transactions from August 2023 to July 2024, with the total height of the stacked bars increasing significantly over time. However, there's a dramatic increase in transaction volume, particularly visible in the top chart. This spike is primarily driven by a sudden surge by Beaverbuild(light purple) and Titan(yellow). The volume nearly doubled compared to the previous month and subsequent months.
After the March 2024 spike, the volume seems to return to its previous growth trend, with Beaverbuild reducing back to its typical proportion. However, the overall volume remains higher than before the spike, suggesting a possible new baseline after this event.
What about the public transaction market?
Seasonal Peaks and Troughs: The volume of public transactions shows fluctuations over time, with notable peaks around February and April 2024. This indicates periods of increased activity, possibly driven by market events or network upgrades.
Rysnc, jetbldr, flashbots, and f1b are examples of builders being cornered by the superiority of Beaverbuild and Titan.
We can also observe the same trends from the charts demonstrating Total Transactions and Total Blocks.
The centralization of the builder market is alarming, manifesting the Matthew Effect getting stronger.
You can change the starting block number, time period of charts, starting time, and end time of the data range to discover the market further.
Dig Into a Single Builder’s Productivity
In the first part of this post, we’ve shown you the beaver’s performance, which can be found in the 2nd section of the dashboard. You can select which builder you’d like to explore.
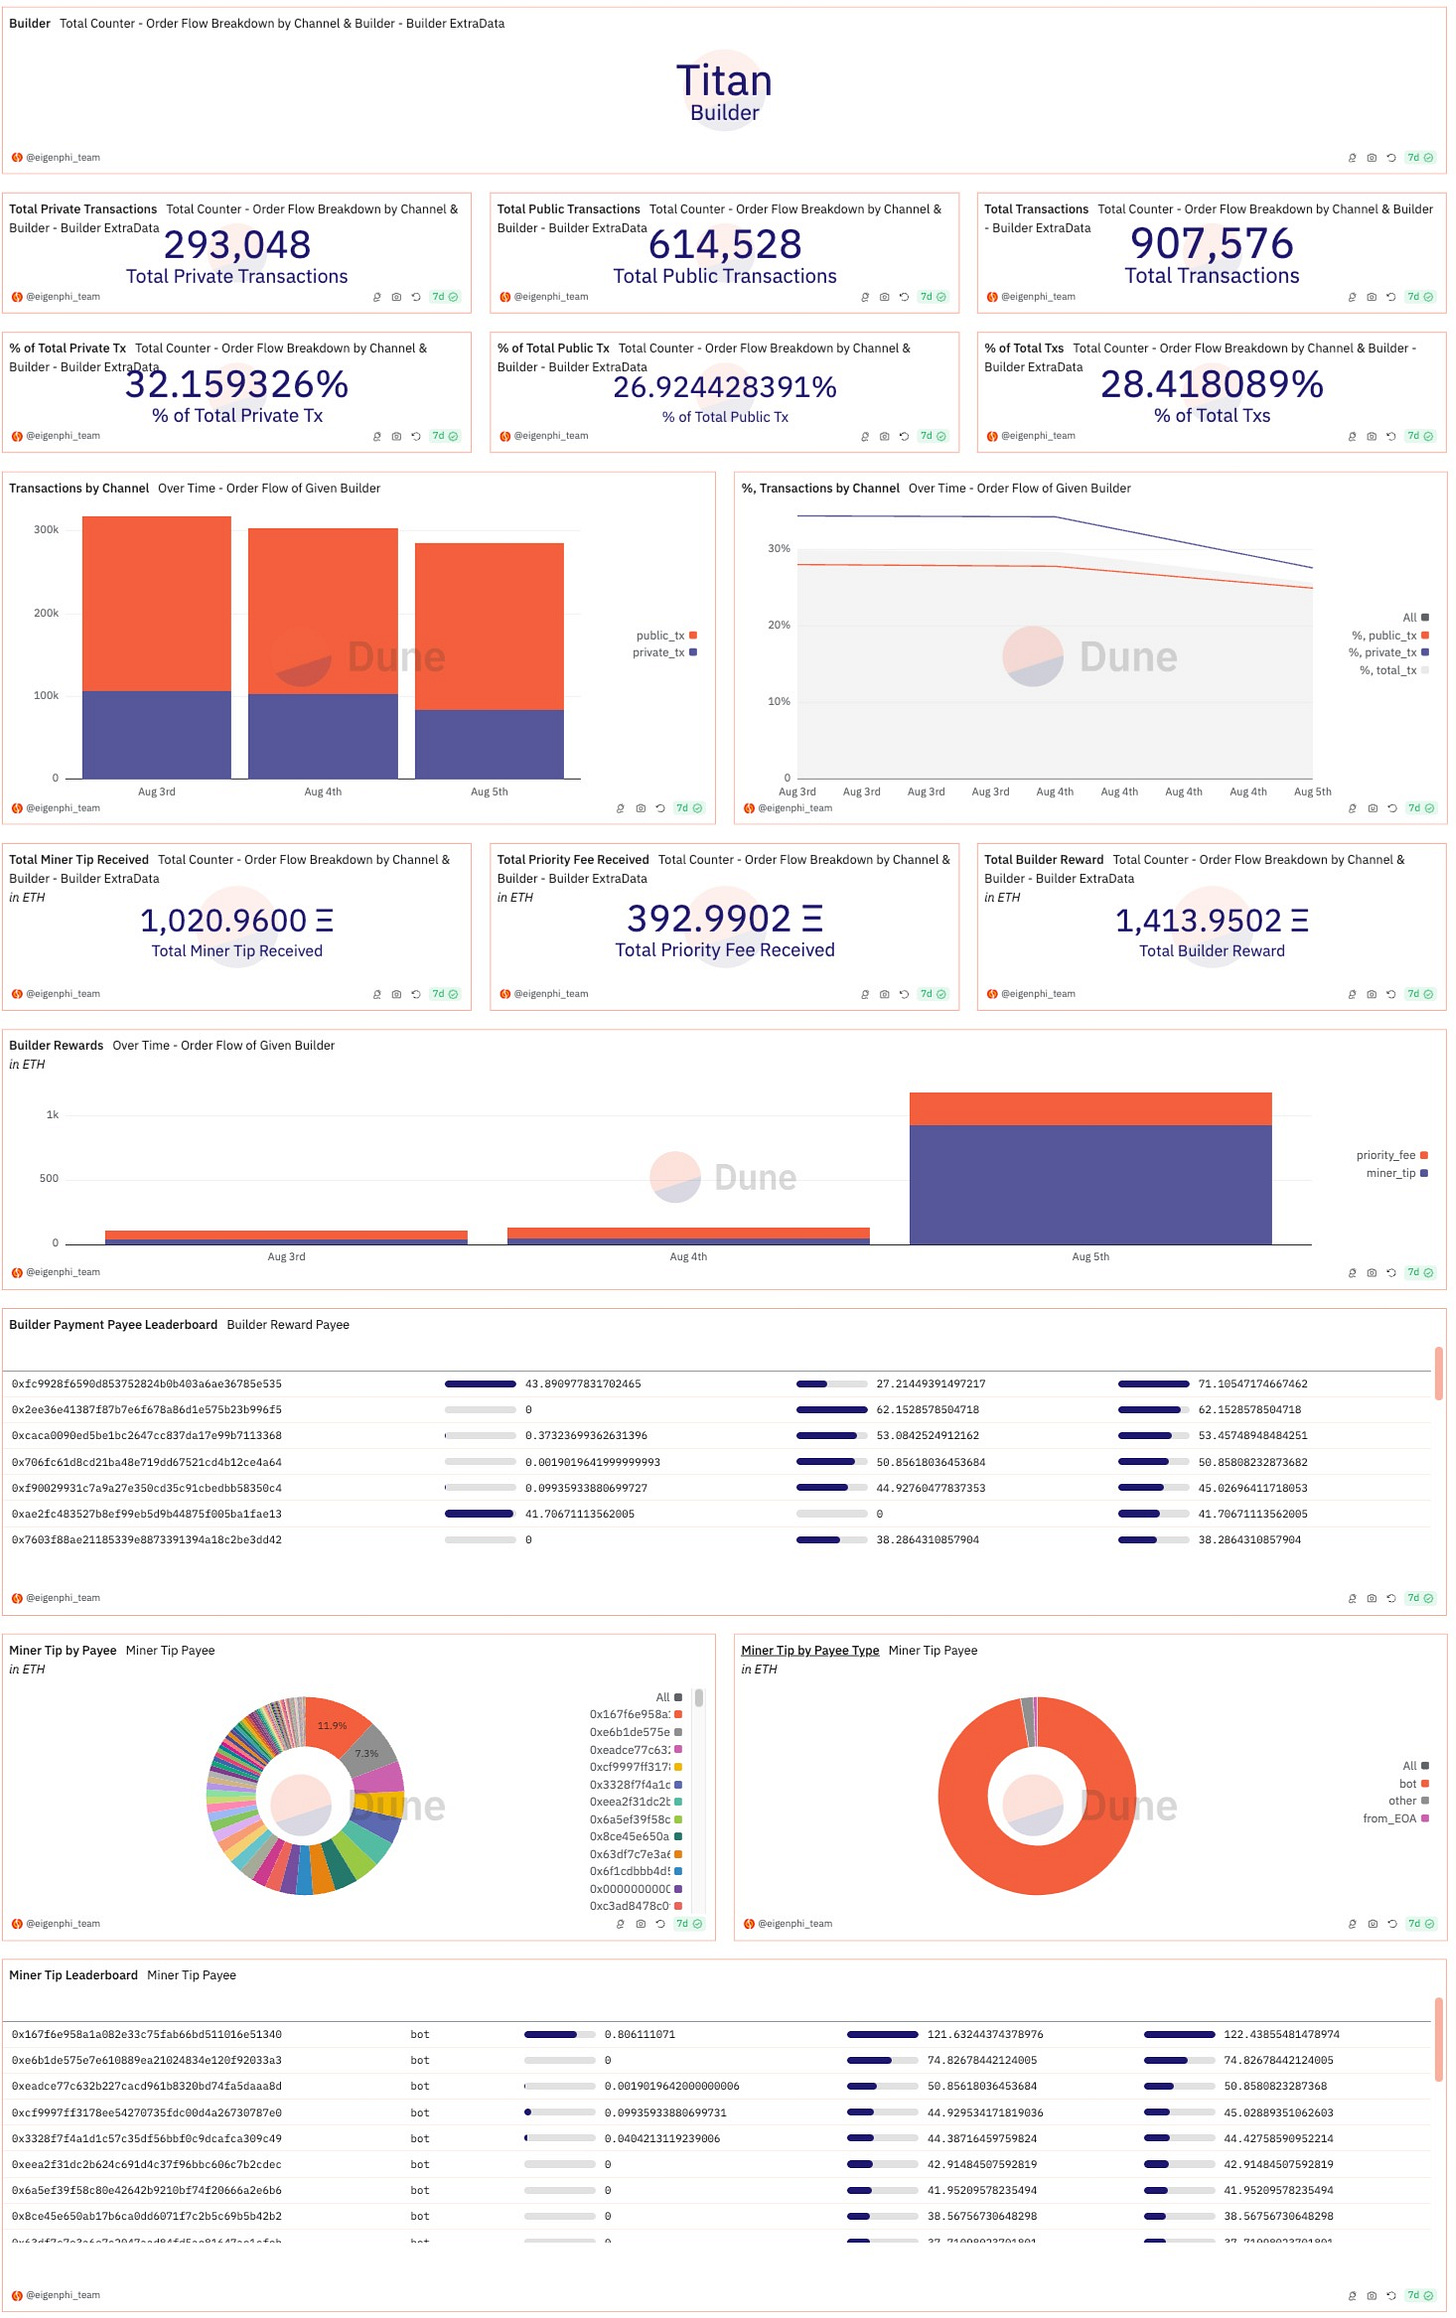
For example, the image below examines the performance of Titan during the three days period mentioned above.
To discover more about the builder you are interested in, visit our Builder Performance Analysis Dashboard.
And stay tuned for more secret winners of the dark dark Black Monday.
Want to learn more about the DeFi lego? Visit our Head First of DeFi to decode the DNA of DeFi Transactions & Strategies.
Follow us via these to dig more hidden wisdom of DeFi:
EigenTx | Website | Discord | Twitter | YouTube | Substack | Medium | Telegram


